
Scores displayed below are based on template data that were extracted from the global assessment. These scores will update when data layers are modified.
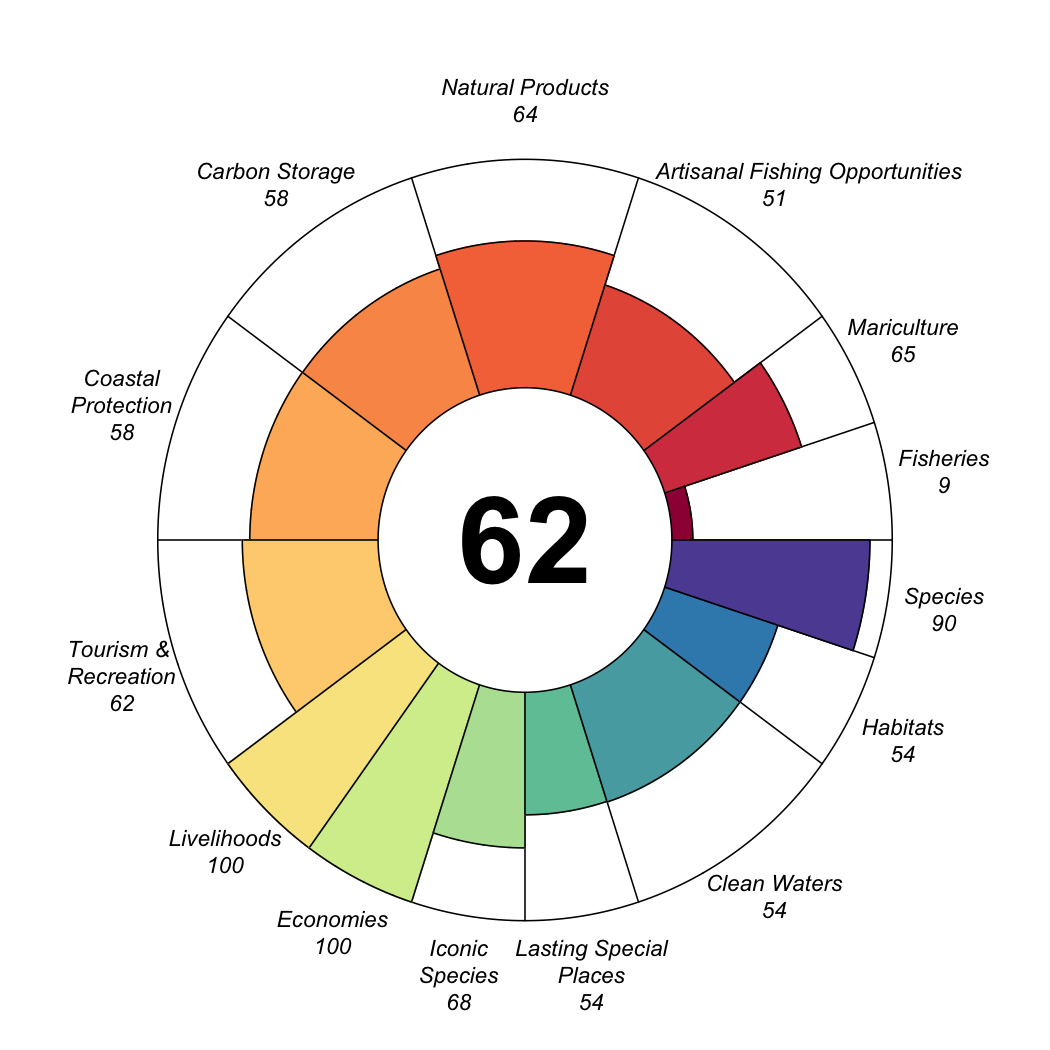
Golfo de Guayaquil
| score | status | future | |
|---|---|---|---|
| Index | 61.94 | NA | 57.28 |
| Food Provision | 38.39 | 37.23 | 39.55 |
| . Fisheries | 9.47 | 9.37 | 9.57 |
| . Mariculture | 65.30 | 63.19 | 67.41 |
| Artisanal Fishing Opportunity | 50.74 | 49.11 | 52.37 |
| Natural Products | 64.24 | 56.44 | 72.04 |
| Carbon Storage | 58.10 | 83.58 | 32.61 |
| Coastal Protection | 58.22 | 83.58 | 32.87 |
| Tourism & Recreation | 61.62 | 46.65 | 76.59 |
| Coastal Livelihoods & Economies | 100.00 | 100.00 | 100.00 |
| . Livelihoods | 100.00 | 100.00 | 100.00 |
| . Economies | 100.00 | 100.00 | 100.00 |
| Sense of Place | 60.88 | 61.52 | 60.25 |
| . Iconic Species | 68.13 | 70.00 | 66.26 |
| . Lasting Special Places | 53.64 | 53.04 | 54.24 |
| Clean Waters | 53.93 | 63.94 | 43.91 |
| Biodiversity | 71.90 | 87.84 | 55.95 |
| . Habitats | 53.94 | 79.18 | 28.70 |
| . Species | 89.85 | 96.51 | 83.20 |
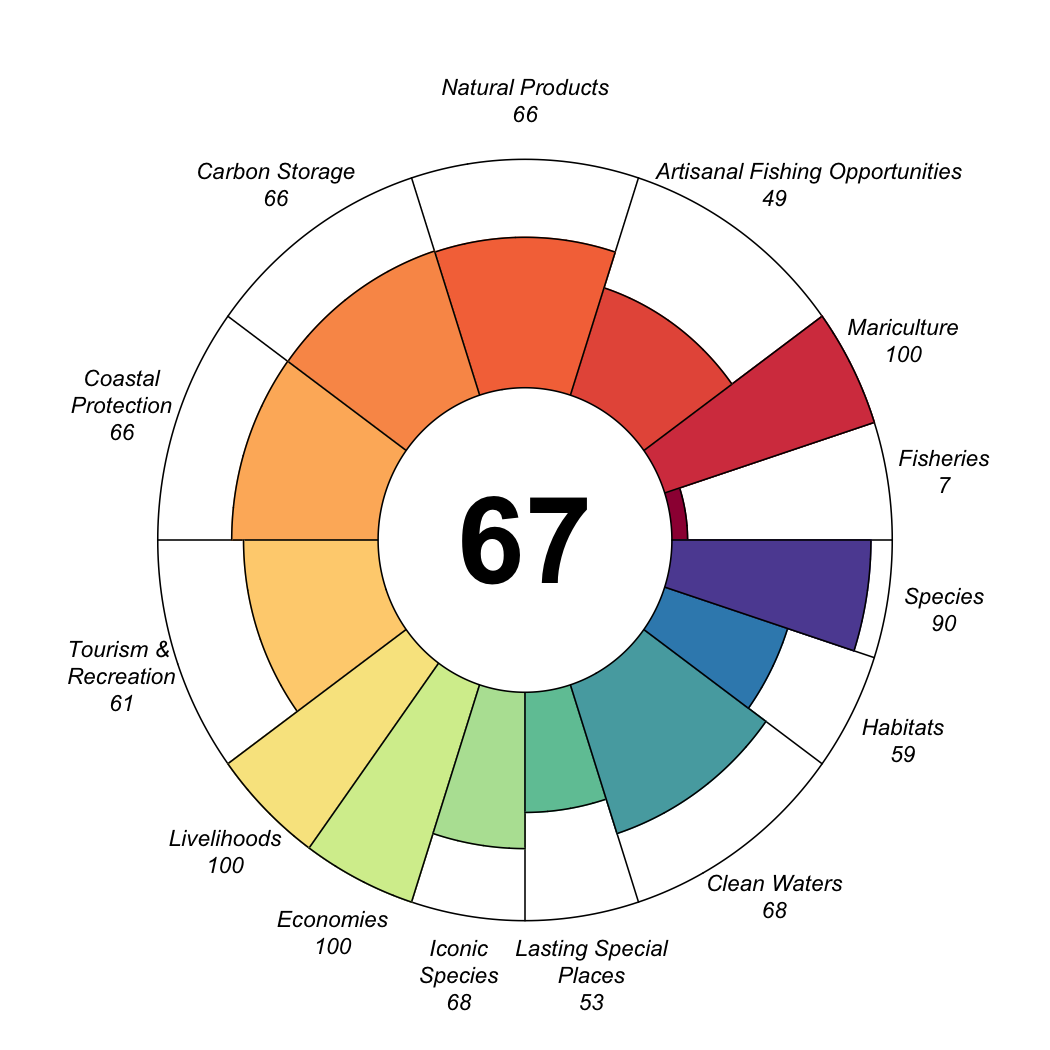
El Oro
| score | status | future | trend | pressures | resilience | |
|---|---|---|---|---|---|---|
| Index | 66.70 | NA | 60.38 | NA | NA | NA |
| Food Provision | 54.48 | 54.43 | 54.53 | 0.22 | NA | NA |
| . Fisheries | 7.10 | 7.00 | 7.20 | 0.00 | 41.14 | 49.70 |
| . Mariculture | 100.00 | 100.00 | 100.00 | 0.43 | 37.39 | 59.79 |
| Artisanal Fishing Opportunity | 49.41 | 47.82 | 51.00 | 0.00 | 39.14 | 59.26 |
| Natural Products | 65.85 | 57.53 | 74.18 | 0.33 | 39.18 | 60.59 |
| Carbon Storage | 66.33 | 95.00 | 37.66 | -1.00 | 35.89 | 56.01 |
| Coastal Protection | 66.43 | 95.00 | 37.85 | -1.00 | 35.27 | 56.01 |
| Tourism & Recreation | 61.06 | 46.23 | 75.89 | 1.00 | 62.16 | 53.59 |
| Coastal Livelihoods & Economies | 100.00 | 100.00 | 100.00 | 0.50 | NA | NA |
| . Livelihoods | 100.00 | 100.00 | 100.00 | 0.00 | 35.94 | 54.15 |
| . Economies | 100.00 | 100.00 | 100.00 | 1.00 | 37.41 | 42.80 |
| Sense of Place | 60.52 | 60.94 | 60.10 | -0.05 | NA | NA |
| . Iconic Species | 68.44 | 70.00 | 66.87 | -0.11 | 45.61 | 53.44 |
| . Lasting Special Places | 52.60 | 51.87 | 53.33 | 0.00 | 49.75 | 58.28 |
| Clean Waters | 68.46 | 82.22 | 54.70 | -0.36 | 82.16 | 53.59 |
| Biodiversity | 74.47 | 91.09 | 57.85 | -0.60 | NA | NA |
| . Habitats | 58.64 | 85.67 | 31.60 | -1.00 | 42.28 | 54.05 |
| . Species | 90.31 | 96.51 | 84.10 | -0.19 | 49.57 | 50.06 |
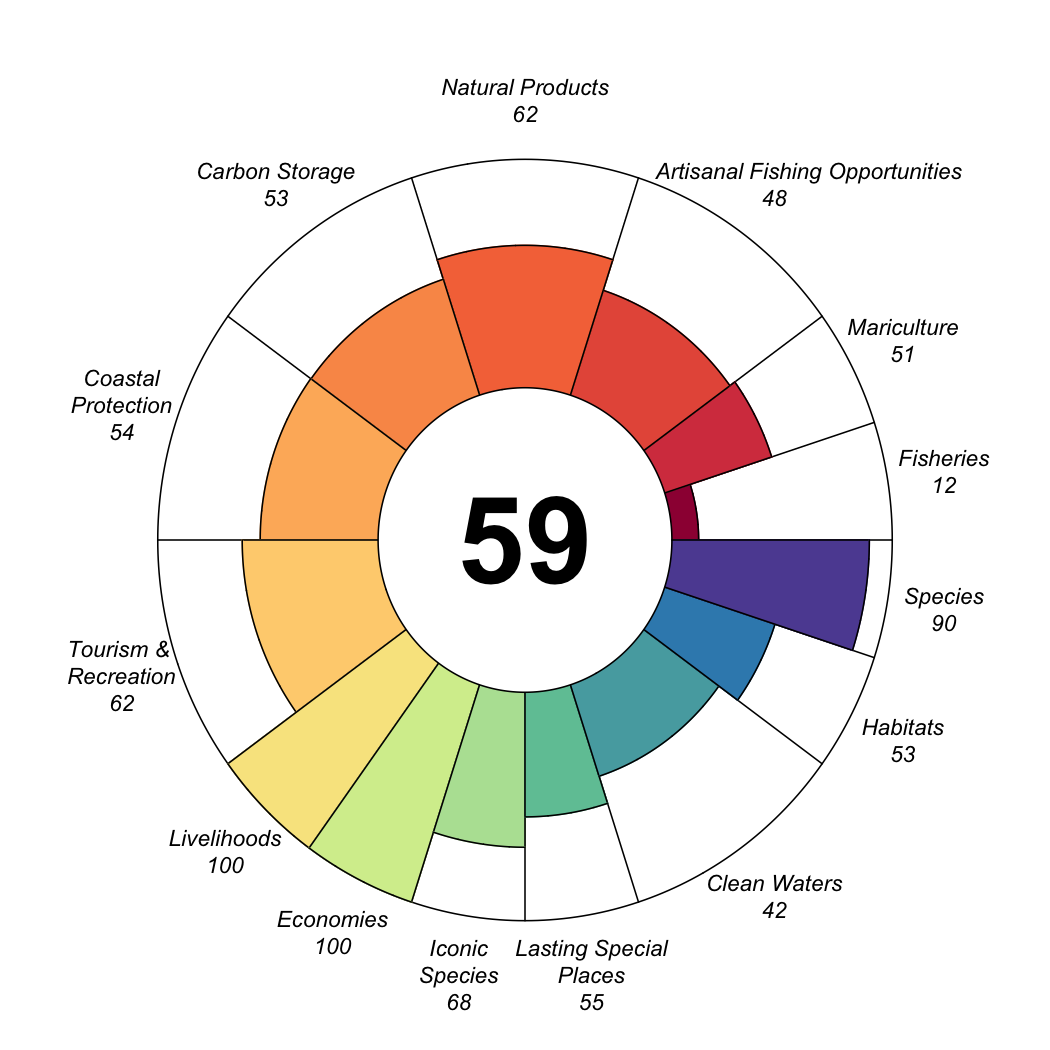
Guayas
| score | status | future | trend | pressures | resilience | |
|---|---|---|---|---|---|---|
| Index | 58.62 | NA | 53.88 | NA | NA | NA |
| Food Provision | 32.74 | 30.94 | 34.54 | 0.09 | NA | NA |
| . Fisheries | 12.12 | 12.00 | 12.23 | 0.00 | 43.84 | 49.70 |
| . Mariculture | 51.02 | 47.73 | 54.31 | 0.17 | 52.50 | 59.79 |
| Artisanal Fishing Opportunity | 48.25 | 46.74 | 49.77 | 0.00 | 40.37 | 59.26 |
| Natural Products | 62.34 | 55.03 | 69.64 | 0.29 | 39.70 | 60.59 |
| Carbon Storage | 53.35 | 77.00 | 29.70 | -1.00 | 39.14 | 56.01 |
| Coastal Protection | 53.50 | 77.00 | 29.99 | -1.00 | 37.98 | 56.01 |
| Tourism & Recreation | 61.67 | 46.69 | 76.65 | 1.00 | 62.16 | 53.59 |
| Coastal Livelihoods & Economies | 100.00 | 100.00 | 100.00 | 0.50 | NA | NA |
| . Livelihoods | 100.00 | 100.00 | 100.00 | 0.00 | 41.32 | 54.15 |
| . Economies | 100.00 | 100.00 | 100.00 | 1.00 | 43.98 | 42.80 |
| Sense of Place | 61.20 | 62.02 | 60.38 | -0.05 | NA | NA |
| . Iconic Species | 67.85 | 70.00 | 65.69 | -0.11 | 50.72 | 53.44 |
| . Lasting Special Places | 54.55 | 54.03 | 55.06 | 0.00 | 53.03 | 58.28 |
| Clean Waters | 42.08 | 51.24 | 32.93 | -0.39 | 82.16 | 53.59 |
| Biodiversity | 71.09 | 87.01 | 55.17 | -0.60 | NA | NA |
| . Habitats | 52.60 | 77.52 | 27.68 | -1.00 | 45.85 | 54.05 |
| . Species | 89.59 | 96.51 | 82.67 | -0.19 | 54.09 | 50.06 |
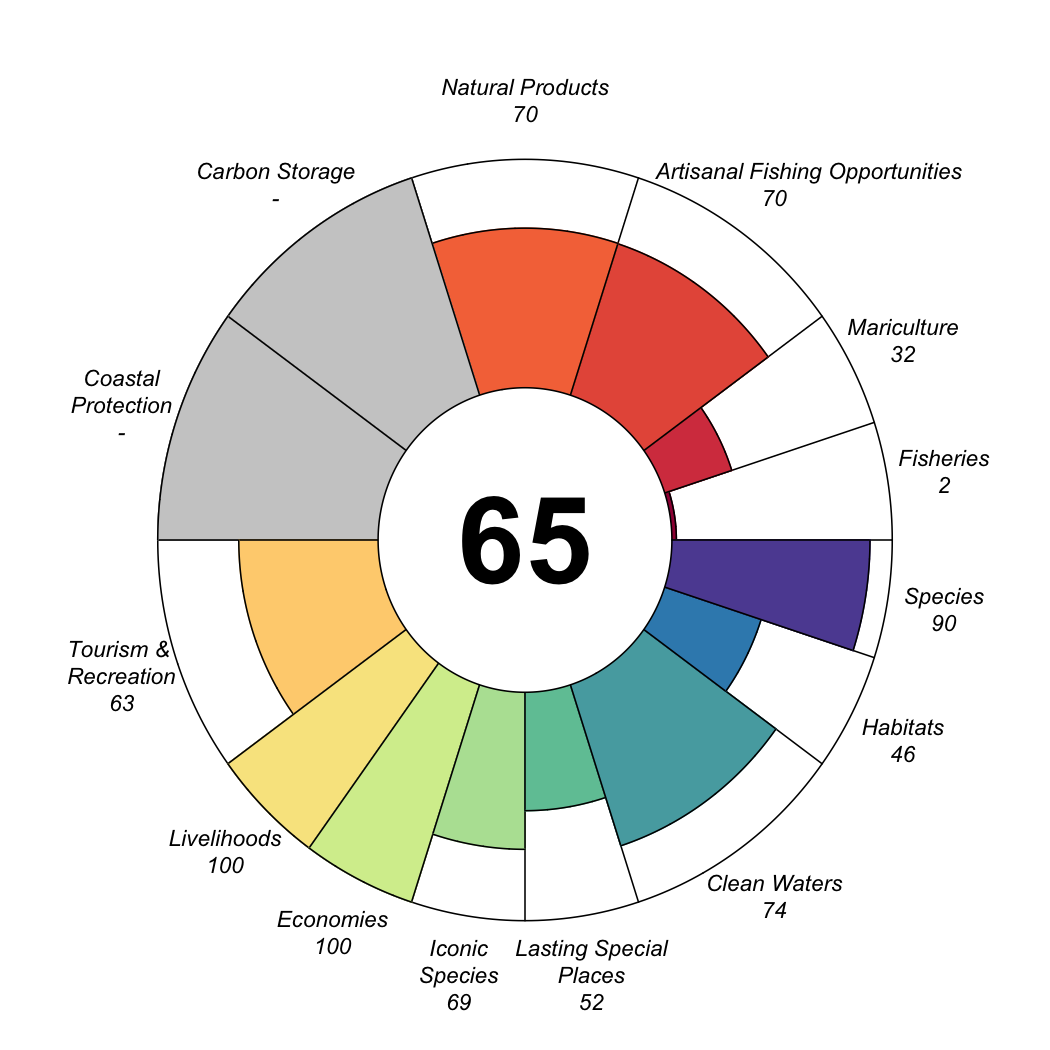
Santa Elena
| score | status | future | trend | pressures | resilience | |
|---|---|---|---|---|---|---|
| Index | 65.30 | NA | 66.72 | NA | NA | NA |
| Food Provision | 17.30 | 16.11 | 18.49 | 0.08 | NA | NA |
| . Fisheries | 2.02 | 2.00 | 2.05 | 0.00 | 42.53 | 49.70 |
| . Mariculture | 31.98 | 29.67 | 34.28 | 0.15 | 43.16 | 59.79 |
| Artisanal Fishing Opportunity | 69.70 | 67.24 | 72.17 | 0.01 | 39.36 | 59.26 |
| Natural Products | 69.86 | 60.96 | 78.77 | 0.34 | 40.17 | 60.59 |
| Carbon Storage | NA | NA | NA | NA | 35.45 | 56.01 |
| Coastal Protection | NA | NA | NA | NA | 34.90 | 56.01 |
| Tourism & Recreation | 63.22 | 47.86 | 78.58 | 1.00 | 62.16 | 53.59 |
| Coastal Livelihoods & Economies | 100.00 | 100.00 | 100.00 | 0.50 | NA | NA |
| . Livelihoods | 100.00 | 100.00 | 100.00 | 0.00 | 37.65 | 54.15 |
| . Economies | 100.00 | 100.00 | 100.00 | 1.00 | 39.60 | 42.80 |
| Sense of Place | 60.30 | 60.57 | 60.03 | -0.05 | NA | NA |
| . Iconic Species | 68.76 | 70.00 | 67.51 | -0.11 | 42.83 | 53.44 |
| . Lasting Special Places | 51.84 | 51.15 | 52.54 | 0.00 | 50.05 | 58.28 |
| Clean Waters | 74.09 | 76.54 | 71.64 | 0.05 | 82.16 | 53.59 |
| Biodiversity | 67.93 | 81.78 | 54.08 | -0.60 | NA | NA |
| . Habitats | 45.98 | 67.06 | 24.90 | -1.00 | 41.51 | 54.05 |
| . Species | 89.88 | 96.51 | 83.26 | -0.19 | 52.22 | 50.06 |