Chapter 8 Programming in R
8.1 Objectives & Resources
Now we are going to build a little analysis. We will learn to automate our analyses with a for loop. We will make figures, and save them each with automated labeling. Then, we will join data from different files and conditionally label them with if/else statements.
8.1.1 Objectives
- create an R script
- for loops
- joining data
- if statements
8.2 Analysis plan
## Error in library(gapminder): there is no package called 'gapminder'OK, here is the plan for our analysis. We want to plot the gdpPercap for each country in the gapminder data frame. So that’s 142 separate plots! We will automate this, labeling each one with its name and saving it in a folder called figures. We will learn a bunch of things as we go.
8.3 Create an R script
OK, now, we are going to create an R script. What is an R script? It’s a text file with a .R extension. We’ve been writing R code in R Markdown files so far; R scripts are just R code without the Markdown along with it.
Go to File > New File > R Script (or click the green plus in the top left corner).
Let’s start off with a few comments so that we know what it is for, and save it:
## gapminder-analysis.R
## analysis with gapminder data
## J Lowndes lowndes@nceas.ucsb.edu
We’ll be working with the gapminder data again so let’s read it in here:
## load libraries
library(tidyverse)

## read in gapminder data
gapminder <- readr::read_csv('https://raw.githubusercontent.com/OHI-Science/data-science-training/master/data/gapminder.csv')
Remember, like in R Markdown, hitting return does not execute this command. To execute it, we need to get what we typed in the script down into the console. Here is how we can do that:
- copy-paste this line into the console.
- select the line (or simply put the cursor there), and click ‘Run’. This is available from
- the bar above the script (green arrow)
- the menu bar: Code > Run Selected Line(s)
- keyboard shortcut: command-return
- source the script, which means running the whole thing. This is also great for to see if there are any typos in your code that you’ve missed. You can do this by:
- clicking Source (blue arrow in the bar above the script).
- typing
source('gapminder-analysis.R')in the console (or from another R file!!!).
8.4 Automation with for loops
Our plan is to plot gdpPercap for each country. This means that we want to do the same operation (plotting gdpPercap) on a bunch of different things (countries). Yesterday we learned the dplyr’s group_by() function, and this is super powerful to automate through groups. But there are things that you may not want to do with group_by(), like plotting. So we will use a for loop.
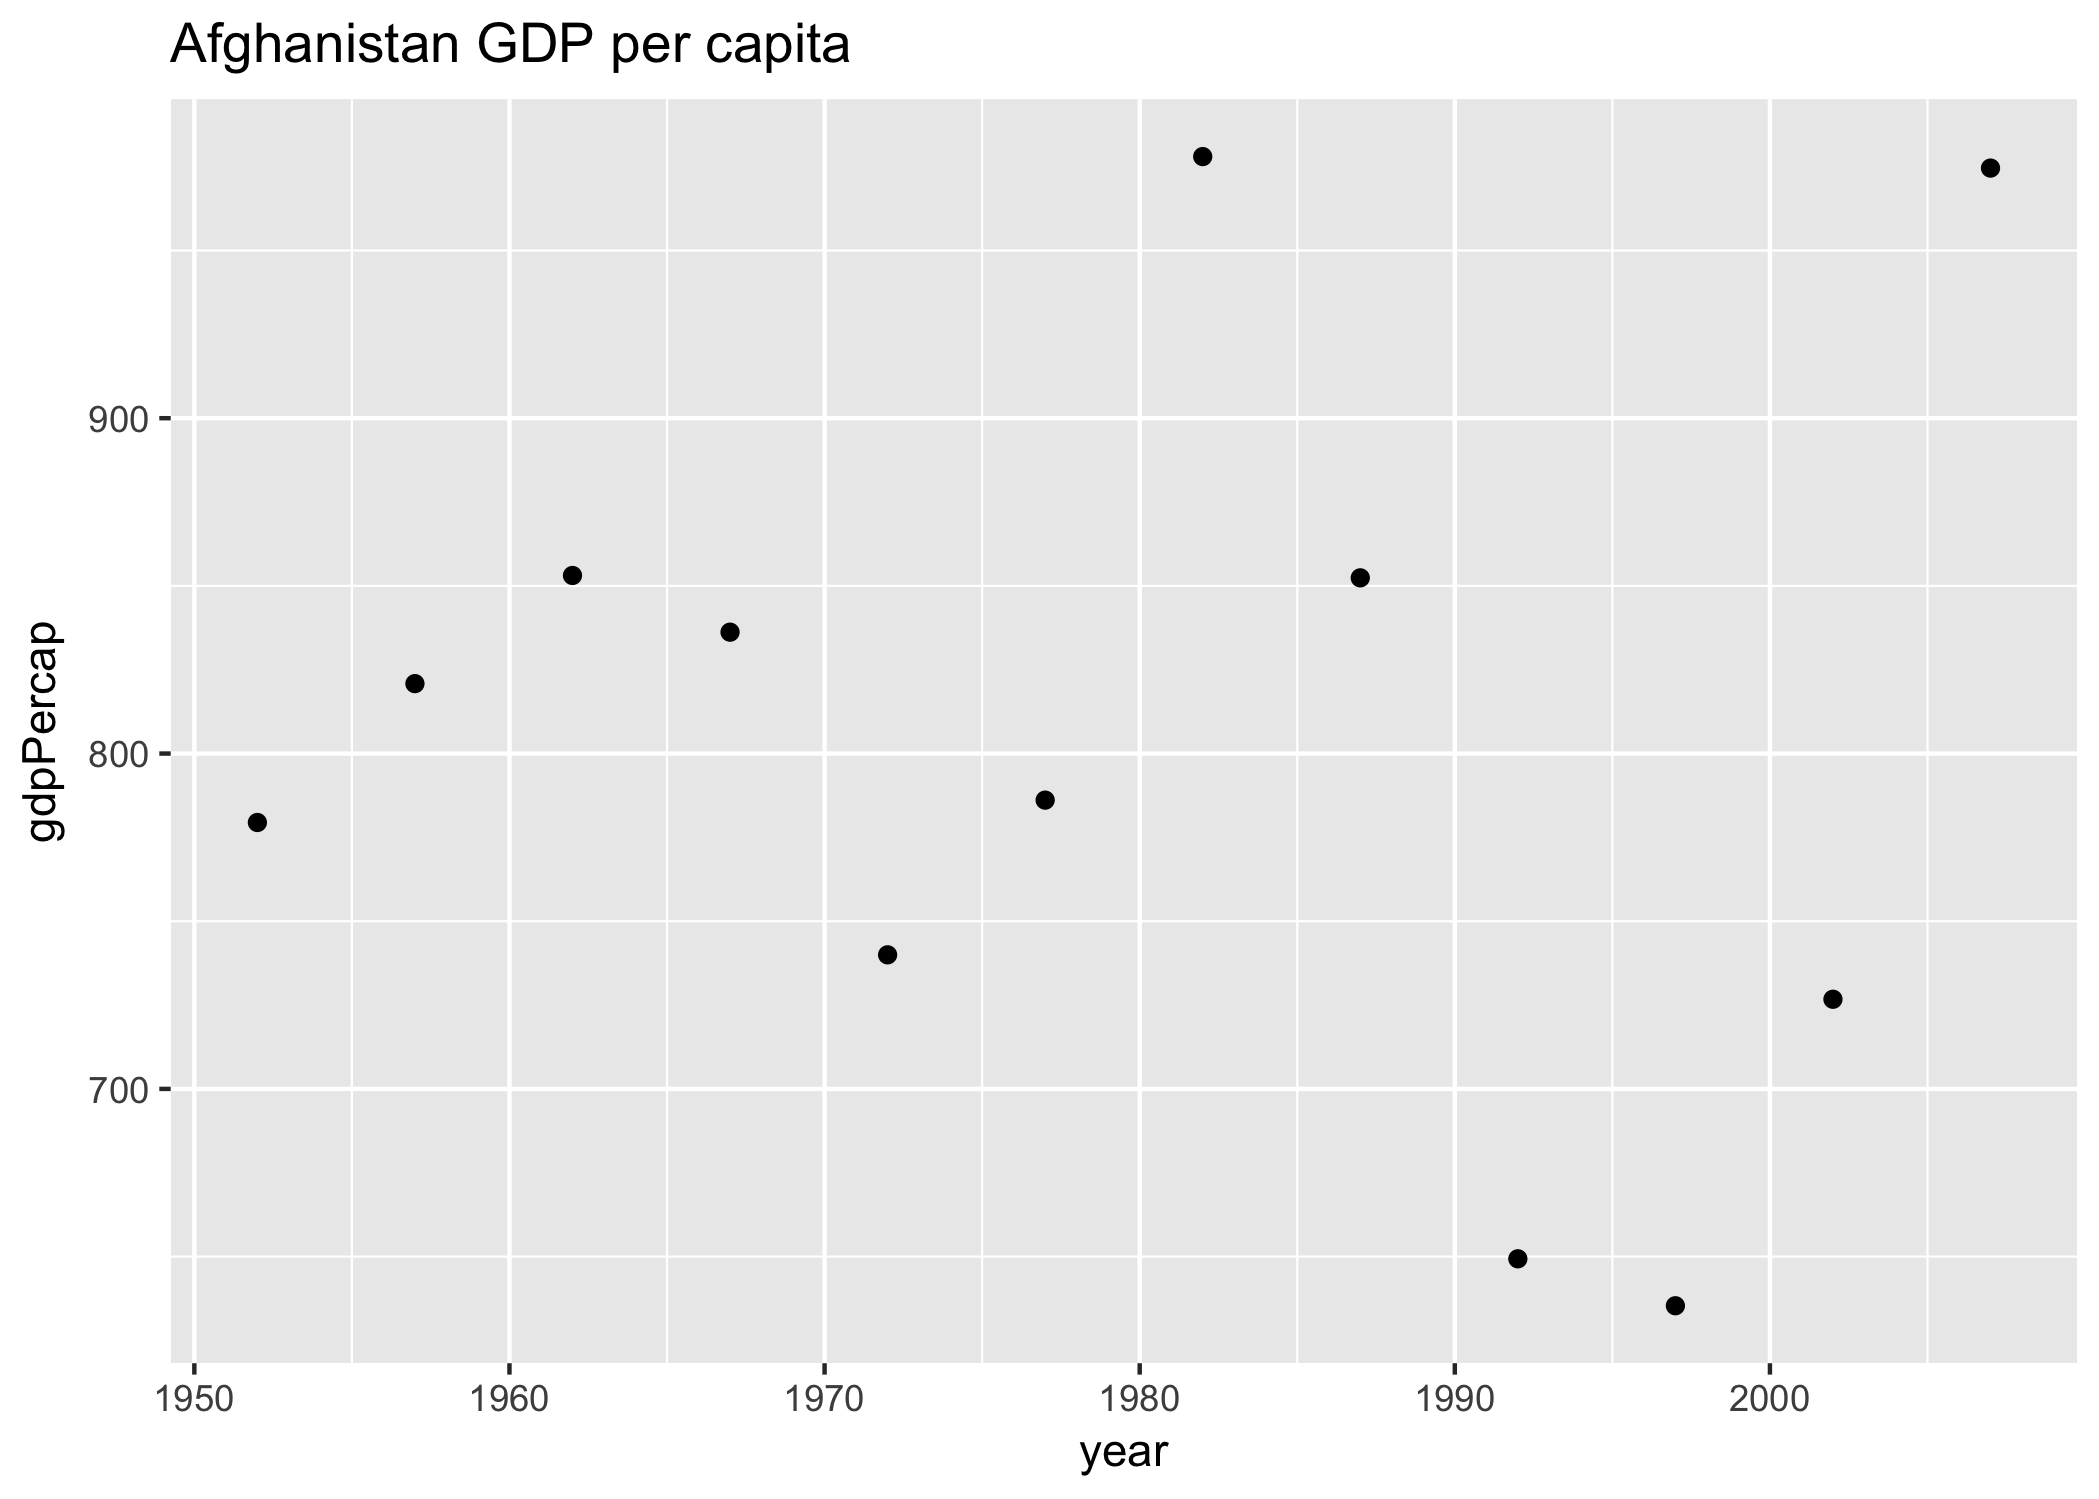
Let’s start off with what this would look like for just one country. I’m going to demonstrate with Afghanistan:
## filter the country to plot
gap_to_plot <- gapminder %>%
  filter(country == "Afghanistan")

## plot
my_plot <- ggplot(data = gap_to_plot, aes(x = year, y = gdpPercap)) +
  geom_point() +
  labs(title = "Afghanistan")
Let’s actually give this a better title than just the country name. Let’s use the base::paste() function from to paste two strings together so that the title is more descriptive. Use ?paste to see what the “sep” variable does.
## filter the country to plot
gap_to_plot <- gapminder %>%
  filter(country == "Afghanistan")

## plot
my_plot <- ggplot(data = gap_to_plot, aes(x = year, y = gdpPercap)) +
  geom_point() +
  ## add title and save
  labs(title = paste("Afghanistan", "GDP per capita", sep = " "))
And as a last step, let’s save this figure.
## filter the country to plot
gap_to_plot <- gapminder %>%
  filter(country == "Afghanistan")

## plot
my_plot <- ggplot(data = gap_to_plot, aes(x = year, y = gdpPercap)) +
  geom_point() +
  ## add title and save
  labs(title = paste("Afghanistan", "GDP per capita", sep = " "))

ggsave(filename = "Afghanistan_gdpPercap.png", plot = my_plot)
OK. So we can check our repo in the file pane (bottom right of RStudio) and see the generated figure:
8.4.1 Thinking ahead: cleaning up our code
Now, in our code above, we’ve had to write out “Afghanistan” several times. This makes it not only typo-prone as we type it each time, but if we wanted to plot another country, we’d have to write that in 3 places too. It is not setting us up for an easy time in our future, and thinking ahead in programming is something to keep in mind.
Instead of having “Afghanistan” written 3 times, let’s instead create an object that we will assign to “Afghanistan”. We won’t name our object “country” because that’s a column header with gapminder, and will just confuse us. Let’s make it distinctive: let’s write cntry (country without vowels):
Now, we can replace each "Afghanistan" with our variable cntry. We will have to introduce a paste statement here too, and we want to separate by nothing (""). Note: there are many ways to create the filename, and we are doing it this way for a specific reason right now.
## create country variable
cntry <- "Afghanistan"
## filter the country to plot
gap_to_plot <- gapminder %>%
filter(country == cntry)
## plot
my_plot <- ggplot(data = gap_to_plot, aes(x = year, y = gdpPercap)) +
geom_point() +
## add title and save
labs(title = paste(cntry, "GDP per capita", sep = " "))
## note: there are many ways to create filenames with paste() or file.path(); we are doing this way for a reason.
ggsave(filename = paste(cntry, "_gdpPercap.png", sep = ""), plot = my_plot)Let’s run this. Great! it saved our figure (I can tell this because the timestamp in the Files pane has updated!)
8.4.2 For loop basic structure
Now, how about if we want to plot not only Afghanistan, but other countries as well? There wasn’t actually that much code needed to get us here, but we definitely do not want to copy this for every country. Even if we copy-pasted and switched out the country assigned to the cntry variable, it would be very typo-prone. Plus, what if you wanted to instead plot lifeExp? You’d have to remember to change it each time…it gets messy quick.
Better with a for loop. This will let us cycle through and do what we want to each thing in turn. If you want to iterate over a set of values, and perform the same operation on each, a for loop will do the job.
Sit back and watch me for a few minutes while we develop the for loop. Then we’ll give you time to do this on your computers as well.
The basic structure of a for loop is:
Note the ( ) and the { }. We talk about iterating through each item in the for loop, which makes each item an iterator.
So looking back at our Afghanistan code: all of this is pretty much the “do a thing” part. And we can see that there are only a few places that are specific to Afghanistan. If we could make those places not specific to Afghanistan, we would be set.
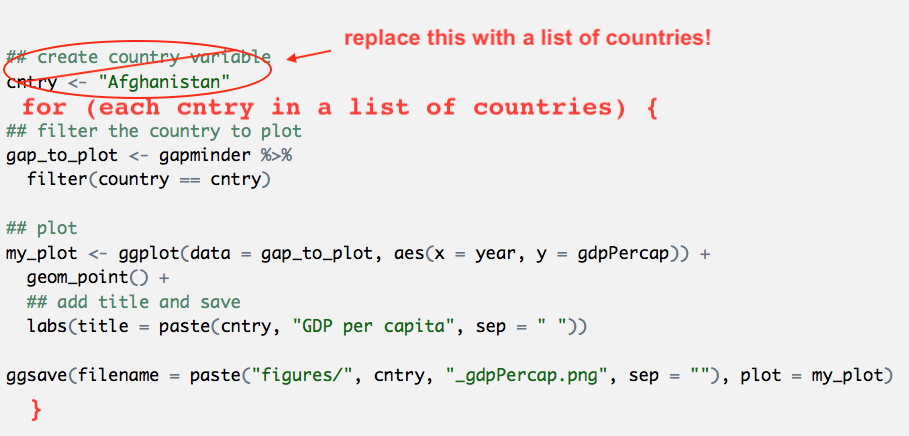
Let’s paste from what we had before, and modify it. I’m also going to use RStudio’s indentation help to indent the lines within the for loop by highlighting the code in this chunk and going to Code > Reindent Lines (shortcut: command I)
## create country variable
cntry <- "Afghanistan"

for (each cntry in a list of countries ) {

  ## filter the country to plot
  gap_to_plot <- gapminder %>%
    filter(country == cntry)

  ## plot
  my_plot <- ggplot(data = gap_to_plot, aes(x = year, y = gdpPercap)) +
    geom_point() +
    ## add title and save
    labs(title = paste(cntry, "GDP per capita", sep = " "))

  ggsave(filename = paste(cntry, "_gdpPercap.png", sep = ""), plot = my_plot)

}
8.4.3 Executable for loop!
OK. So let’s start with the beginning of the for loop. We want a list of countries that we will iterate through. We can do that by adding this code before the for loop.
## create a list of countries
country_list <- c("Albania", "Fiji", "Spain")

for ( cntry in country_list ) {

  ## filter the country to plot
  gap_to_plot <- gapminder %>%
    filter(country == cntry)

  ## plot
  my_plot <- ggplot(data = gap_to_plot, aes(x = year, y = gdpPercap)) +
    geom_point() +
    ## add title and save
    labs(title = paste(cntry, "GDP per capita", sep = " "))

  ggsave(filename = paste(cntry, "_gdpPercap.png", sep = ""), plot = my_plot)

}
At this point, we do have a functioning for loop. For each item in the country_list, the for loop will iterate over the code within the { }, changing cntry each time as it goes through the list. And we can see it works because we can see them appear in the files pane at the bottom right of RStudio!
Great! And it doesn’t matter if we just use these three countries or all the countries–let’s try it.
But first let’s create a figure directory and make sure it saves there since it’s going to get out of hand quickly. We could do this from the Finder/Windows Explorer, or from the “Files” pane in RStudio by clicking “New Folder” (green plus button). But we are going to do it in R. A folder is called a directory:
dir.create("figures")

## create a list of countries
country_list <- unique(gapminder$country) # ?unique() returns the unique values

for( cntry in country_list ){

  ## filter the country to plot
  gap_to_plot <- gapminder %>%
    filter(country == cntry)

  ## plot
  my_plot <- ggplot(data = gap_to_plot, aes(x = year, y = gdpPercap)) +
    geom_point() +
    ## add title and save
    labs(title = paste(cntry, "GDP per capita", sep = " "))

  ## add the figures/ folder
  ggsave(filename = paste("figures/", cntry, "_gdpPercap.png", sep = "")), plot = my_plot)
}
So that took a little longer than just the 3, but still super fast. For loops are sometimes just the thing you need to iterate over many things in your analyses.
8.4.4 Clean up our repo
OK we now have 142 figures that we just created. They exist locally on our computer, and we have the code to recreate them anytime. But, we don’t really need to push them to GitHub. Let’s delete the figures/ folder and see it disappear from the Git tab.
8.4.5 Your turn
- Modify our for loop so that it:
- loops through countries in Europe only
- plots the cumulative mean gdpPercap (Hint: Use the Data Wrangling Cheatsheet!)
- saves them to a new subfolder inside the (recreated) figures folder called “Europe”.
- Sync to GitHub
8.4.5.1 Answer
No peeking!
dir.create("figures")
dir.create("figures/Europe")

## create a list of countries. Calculations go here, not in the for loop
gap_europe <- gapminder %>%
  filter(continent == "Europe") %>%
  mutate(gdpPercap_cummean = dplyr::cummean(gdpPercap))

country_list <- unique(gap_europe$country) # ?unique() returns the unique values

for( cntry in country_list ){ # (cntry = country_list[1])

  ## filter the country to plot
  gap_to_plot <- gap_europe %>%
    filter(country == cntry)

  ## add a print message to see what's plotting
  print(paste("Plotting", cntry))

  ## plot
  my_plot <- ggplot(data = gap_to_plot, aes(x = year, y = gdpPercap_cummean)) +
    geom_point() +
    ## add title and save
    labs(title = paste(cntry, "GDP per capita", sep = " "))

  ggsave(filename = paste("figures/Europe/", cntry, "_gdpPercap_cummean.png", sep = "")),
  plot = my_plot)
}
Notice how we put the calculation for cummean() outside the for loop. It could have gone inside, but it’s an operation that could be done just one time before hand (outside the loop) rather than multiple times as you go (inside the for loop).
8.5 Conditional statements with if and else
Often when we’re coding we want to control the flow of our actions. This can be done by setting actions to occur only if a condition or a set of conditions are met.
In R and other languages, these are called “if statements”.
8.5.1 if statement basic structure
# if
if (condition is true) {
  do something
}

# if ... else
if (condition is true) {
  do something
} else {  # that is, if the condition is false,
  do something different
}
Let’s bring this concept into our for loop for Europe that we’ve just done. What if we want to add the label “Estimated” to countries that were estimated? Here’s what we’d do.
First, import csv file with information on whether data was estimated or reported, and join to gapminder dataset:
est <- readr::read_csv('https://raw.githubusercontent.com/OHI-Science/data-science-training/master/data/countries_estimated.csv')
gapminder_est <- left_join(gapminder, est)dir.create("figures")
dir.create("figures/Europe")
## create a list of countries
gap_europe <- gapminder_est %>% ## use instead of gapminder
filter(continent == "Europe") %>%
mutate(gdpPercap_cummean = dplyr::cummean(gdpPercap))
country_list <- unique(gap_europe$country)
for( cntry in country_list ){ # (cntry = country_list[1])
## filter the country to plot
gap_to_plot <- gap_europe %>%
filter(country == cntry)
## add a print message
print(paste("Plotting", cntry))
## plot
my_plot <- ggplot(data = gap_to_plot, aes(x = year, y = gdpPercap_cummean)) +
geom_point() +
## add title and save
labs(title = paste(cntry, "GDP per capita", sep = " "))
## if estimated, add that as a subtitle.
if (gap_to_plot$estimated == "yes") {
## add a print statement just to check
print(paste(cntry, "data are estimated"))
my_plot <- my_plot +
labs(sutbtitle("Estimated data"))
}
# Warning message:
# In if (gap_to_plot$estimated == "yes") { :
# the condition has length > 1 and only the first element will be used
ggsave(filename = paste("figures/Europe/", cntry, "_gdpPercap_cummean.png", sep = ""),
plot = my_plot)
} This worked, but we got a warning message with the if statement. This is because if we look at gap_to_plot$estimated, it is many “yes”s or “no”s, and the if statement works just on the first one. We know that if any are yes, all are yes, but you can imagine that this could lead to problems down the line if you didn’t know that. So let’s be explicit:
8.5.2 Executable if statement
dir.create("figures")
dir.create("figures/Europe")


## create a list of countries
gap_europe <- gapminder_est %>% ## use instead of gapminder
  filter(continent == "Europe") %>%
  mutate(gdpPercap_cummean = dplyr::cummean(gdpPercap))

country_list <- unique(gap_europe$country)

for( cntry in country_list ){ # (cntry = country_list[1])

  ## filter the country to plot
  gap_to_plot <- gap_europe %>%
    filter(country == cntry)

  ## add a print message
  print(paste("Plotting", cntry))

  ## plot
  my_plot <- ggplot(data = gap_to_plot, aes(x = year, y = gdpPercap_cummean)) +
    geom_point() +
    ## add title and save
    labs(title = paste(cntry, "GDP per capita", sep = " "))

  ## if estimated, add that as a subtitle.
  if (any(gap_to_plot$estimated == "yes")) { # any() will return a single TRUE or FALSE

    print(paste(cntry, "data are estimated"))

    my_plot <- my_plot +
      labs(subtitle = "Estimated data")
  }
  ggsave(filename = paste("figures/Europe/", cntry, "_gdpPercap_cummean.png", sep = ""),
         plot = my_plot)

}
OK so this is working as we expect! Note that we do not need an else statement above, because we only want to do something (add a subtitle) if one condition is met. But what if we want to add a different subtitle based on another condition, say where the data are reported, to be extra explicit about it?
8.5.3 Executable if/else statement
dir.create("figures")
dir.create("figures/Europe")

## create a list of countries
gap_europe <- gapminder_est %>% ## use instead of gapminder
  filter(continent == "Europe") %>%
  mutate(gdpPercap_cummean = dplyr::cummean(gdpPercap))

country_list <- unique(gap_europe$country)

for( cntry in country_list ){ # (cntry = country_list[1])

  ## filter the country to plot
  gap_to_plot <- gap_europe %>%
    filter(country == cntry)

  ## add a print message
  print(paste("Plotting", cntry))

  ## plot
  my_plot <- ggplot(data = gap_to_plot, aes(x = year, y = gdpPercap_cummean)) +
    geom_point() +
    ## add title and save
    labs(title = paste(cntry, "GDP per capita", sep = " "))

  ## if estimated, add that as a subtitle.
  if (any(gap_to_plot$estimated == "yes")) { # any() will return a single TRUE or FALSE

    print(paste(cntry, "data are estimated"))

    my_plot <- my_plot +
      labs(subtitle = "Estimated data")
  } else {

    my_plot <- my_plot +
      labs(subtitle = "Reported data")

    print(paste(cntry, "data are reported"))

  }
  ggsave(filename = paste("figures/Europe/", cntry, "_gdpPercap_cummean.png", sep = ""),
         plot = my_plot)

}
Note that this works because we know there are only two conditions, Estimated == yes and Estimated == no. In the first if statement we asked for estimated data, and the else condition gives us everything else (which we know is reported). We can be explicit about setting these conditions in the else clause by instead using an else if statement. Below is how you would construct this in your for loop, similar to above:
  if (any(gap_to_plot$estimated == "yes")) { # any() will return a single TRUE or FALSE

    print(paste(cntry, "data are estimated"))

    my_plot <- my_plot +
      labs(subtitle = "Estimated data")
  } else if (any(gap_to_plot$estimated == "no")){

    my_plot <- my_plot +
      labs(subtitle = "Reported data")

    print(paste(cntry, "data are reported"))

  }
This construction is necessary if you have more than two conditions to test for.
8.6 More R!
With just a little bit of time left, here are some things that you can look into more on your own.
8.6.1 Importing and Installing
Here are some really helpful packages for you to work with:
Remember you’ll use install.packages("package-name-in-quotes") to install from CRAN.
readrto read in .csv filesreadxlto read in Excel filesstringrto work with stringslubridateto work with dates
You are also able to install packages directly with Github, using the devtools package. Then, instead of install.packages(), you’ll use devtools::install_github(). And you can create your own packages when you’re ready. Read http://r-pkgs.had.co.nz/ to learn how!
8.6.2 Organization and workflows
- set up a folder for figs, intermediate analyses, final outputs, figures
8.6.3 Getting help
You’ll soon have questions that are outside the scope of this workshop, how do you find answers?
- end with a ton of resources: https://peerj.com/collections/50-practicaldatascistats/
8.7 Ideas for Extended Analysis 2
- stringr() http://r4ds.had.co.nz/strings.html