Open data science for marine management
by Julie Lowndes
The single biggest motivation of the Ocean Health Index project is to use science to inform marine management. And not just any science, the best available science, data, methods, and tools. Open data science is helping us get there, with transparency, reproducibility, collaboration, and communication at its core.
What is open data science? It is the marriage of open science and data science, which means science that anyone can access and reuse without much fuss. Open science is the idea that information will be available to those who need it, whether it’s scientists that want to build from previous work without reinventing the wheel, or managers that want to use that science on the ground. It means that all methods, data, and reporting are available online for anyone to access. And data science is the science of turning raw data into understanding in a reproducible way, which means coding analyses and tracking changes with version control.

Our Ocean Health Index team learned the hard way that we needed open data science practices and tools so that we could work reproducibly with our data. To us, open data science means all analytical steps of a project are coded in an open source language, and shared freely so that anyone else can use it without much fuss.
Open data science practices and tools have been game-changing, and we tell our story in a publication in Nature. Not only are we working reproducibly ourselves — we’re in the process of completing the sixth annual global OHI assessment for 220 coastal countries — but there are twenty groups around the world leading their own OHI assessments. This means they are building off of our science and our code — and each other’s. That’s what this website ohi-science.org is all about: having a one-stop-shop where people can get the resources they need, which means connecting with others and seeing what they’ve done.
Being early adopters of open data science tools and practices means that we need to train others to work the way we do and bring others into the open data science community. This has been a lot of fun because learning this stuff is empowering and it feels great to pass it forward and enable others!
Here are the trainings we have going so far. All of these trainings are written so they can be used by an instructor to teach, or by anyone for self-paced learning. They all require you to follow along and code on your own computer. Also, all of them are in-progress, but you can use them as we develop them.
- Intro to Open Data Science. This is the reproducible workflow we use for OHI, although it’s all OHI-independent and can be useful for anyone wanting to learn! This builds from a Software Carpentry workshop from 2016 in Oxford called Reproducible Science with RStudio and GitHub. We are committed to get people comfortable with the skills they need to do OHI assessments.
- OHI Toolbox Training. This is the official training to use the “OHI Toolbox” software for OHI assessments. The Toolbox is a GitHub repository (which is a bunch of .csv files and .R scripts) that interacts with our
ohicoreR package.
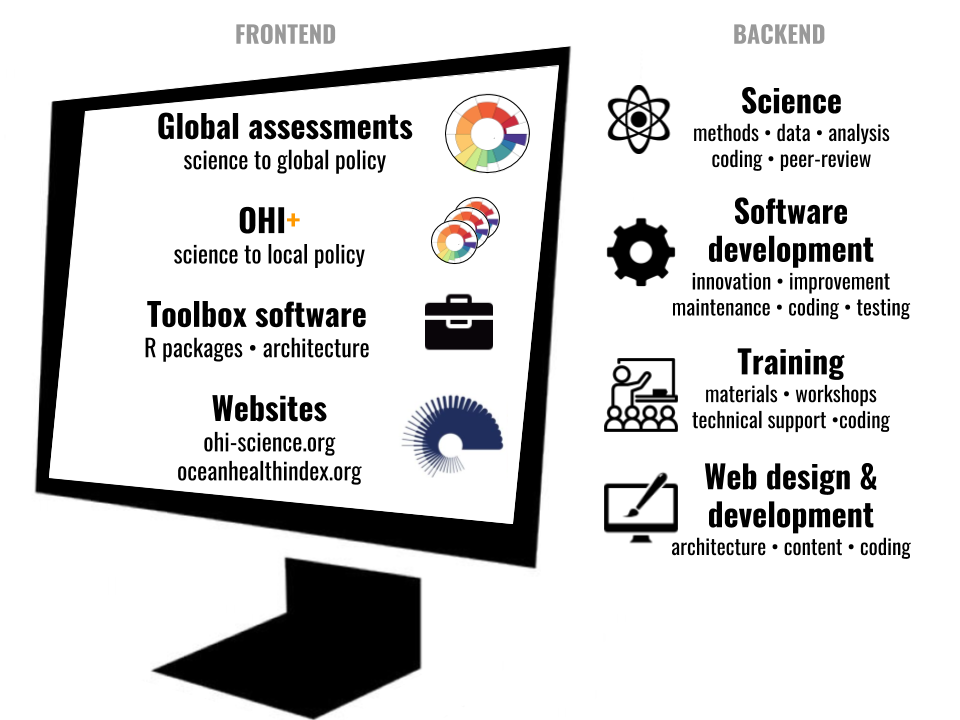
Also, know what’s super cool? All these training materials (and this blog on this website!) have been created using the same tools that these trainings teach, which are the same tools we use for all our data analysis and OHI assessments. Communication and visualization is as important as analyses. Here’s a graphic of all the things our OHI team has been up to, and keep in mind that we do them all with open data science tools (R, RStudio, Git, and GitHub). And you can too.
See also:
- Better science in less time - Nature 2017
- Better science in less time - website
- My Digital Toolbox: Julia Stewart Lowndes - Nature
Related posts: