Fellowship Feature: Expanding mariculture
by Iwen Su
Mariculture as a food provision
With a rise in population comes a rise in protein demand. As of 2017, seafood consumption reached a new high of 20.3 kilograms of fish per person annually, which is double our consumption of the 1960s. In an increasingly crowded world, how do we continue to provide seafood for the global population?
The growth of wild fisheries has remained relatively static since the 1980s, but one industry that has been rapidly growing is aquaculture – the farming of all aquatic species, freshwater and marine. While wild-caught seafood will remain an important part of the global diet, aquaculture serves as a promising source of food for future generations.
Seafood production from aquaculture and wild capture fisheries. Created by: Jamie Afflerbach.
One of the OHI goals - food provision - measures the amount of seafood sustainably harvested within a country’s EEZ and is made up of two sub-goals: fisheries and mariculture, a type of aquaculture performed strictly in the marine environment. The mariculture sub-goal measures the ecological and social sustainability of food provision by marine farm systems using multiple criteria. On the ecological side, OHI accounts for factors such as genetic escapes, endemic species, and water quality management. To assess the social component, we estimate whether countries are fully utilizing the ocean space suitable for mariculture.
Contributing to improvements in data preparation
Every year, methods for the OHI global assessment are improved and data sources are validated for relevance and accuracy by cross-checking with the most recent information. As part of my Fellowship, I was responsible for processing the mariculture data for the 2018 global assessment.
Having just completed my master’s project at the Bren School on the economic feasibility of seaweed aquaculture in Southern California, I was familiar with global seaweed aquaculture trends as well as those in California. However, in looking through the data for the mariculture sub-goal, I noticed seaweed was excluded under the assumption that communities did not depend on them for primary food provision. FAO documentation of the seaweed industry showed otherwise.
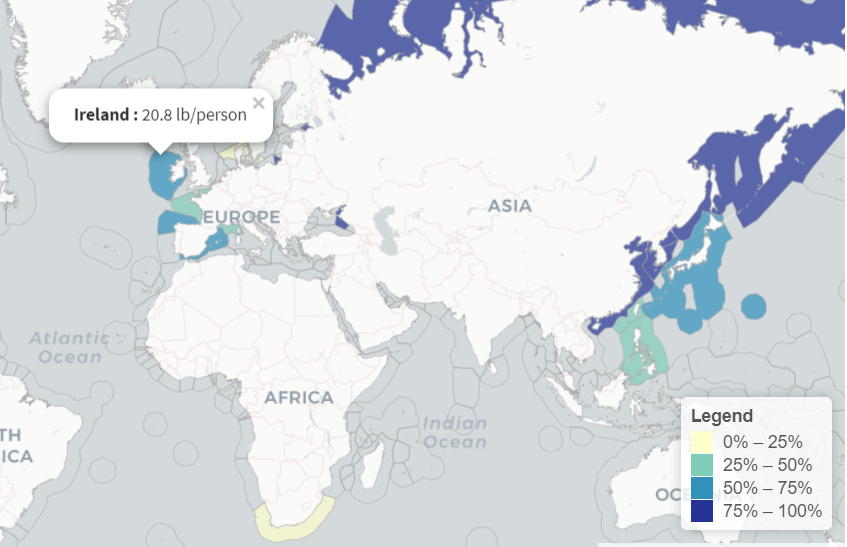
Seaweed mariculture production per coastal population in 2016. Countries that didn’t produce seafood from mariculture are in grey. The top four countries are China, North Korea, South Korea, and Russia. Created by: Iwen Su.
Changing the underlying data behind an assessment requires good rationale and plenty of support for doing so. A consensus must be achieved by the core OHI experts on whether, how, and when to incorporate the change.
After many discussions with the OHI team, I received the green light to start working on edible seaweed production data. The ability to build upon previous knowledge gave me a huge sense of satisfaction. Preparing seaweed data for the assessment involved a thorough literature review of seaweed uses, determining which countries are associated with producing the seaweed, and comparing the results of the score calculation with and without seaweed included. I spent some time researching each of the 38 species of seaweed that are reported by FAO to determine whether the primary use was food provision or miscellaneous purposes, such as agar, cosmetic products, and biofuel. Oftentimes, I would use two to three sources per species for justification.
Reading about the different seaweeds cultivated throughout the world was actually quite interesting. One intriguing find was that Tonga, a mostly uninhabited archipelago in the South Pacific, produces around 400 to 500 tonnes per year of Mozuku almost exclusively for the Japanese food market when there are supply shortages abroad!
OHI Global Dashboard: Visualizing mariculture data
The mariculture sub-goal is only a fraction of how OHI defines global ocean health. So much data goes into the final global assessment score. Users often are curious about how the scores are derived and want to explore the data that powers the scores themselves.
Here is where the OHI Global Dashboard idea came in. Given the increase in relevance of mariculture for food production in recent years, I thought it would be a great opportunity to provide a high-level, global-scale exploration tool that shows summary statistics of the OHI mariculture data. The goal was to provide just enough detail to engage people without diving too deep into specifics of mariculture.
The dashboard allows users to answer questions such as how much seafood is China producing from mariculture relative to other coastal countries? Or what species does Spain cultivate and harvest?
Among R users, Shiny apps have become an increasingly popular way to explore data and this was the platform I selected for the global data dashboard. The main draw to creating a Shiny dashboard is its interactive components and flexibility for visualizing data, text, and graphics. As with all things built with R and GitHub, Shiny inherently promotes accessibility and reproducibility.
One of the main challenges was selecting what information to portray. A downside of Shiny apps is that sometimes people use it as a data dump and add too much information to the dashboard. This can muddle the overall message of the data and the creator can lose sight of what the user might want to see. Much of my design process involved thinking about the OHI Global audience and what kind of story to portray.
Visitors to the dashboard may include a diverse range of ocean enthusiasts who are not necessarily familiar with mariculture. I decided to start with a global map of production across countries to give people a better sense of who is producing most of the farmed seafood. Then I wanted to create a follow-up visual that allows users to explore questions about a single country. What kind of seafood is my country producing? How has mariculture in China grown over the last ten years?
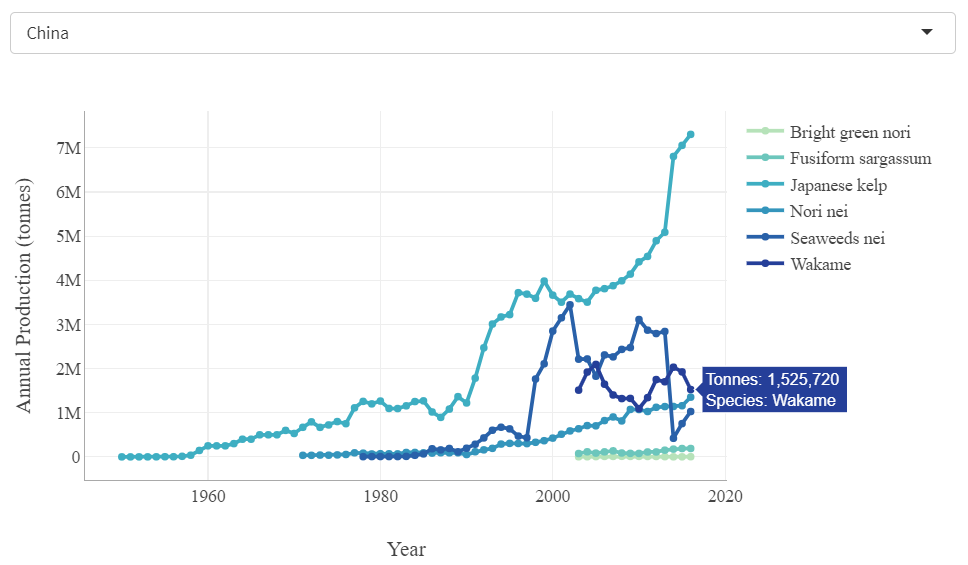
China’s seaweed mariculture production from 1950 to 2016. Japanese kelp cultivation has been the primary mariculture industry in China. Created by: Iwen Su.
What is especially exciting about my Shiny independent project is that I templated the OHI Global Dashboard, making it easier for future fellows to add other goals to the dashboard. All documentation is available on GitHub.
2018 OHI Global Fellowship comes to a close
Along with Camila and Ellie, I completed the first OHI Global Fellowship. Through the process, I gained two lifelong mentors and a network of innovative and passionate data scientists. I developed a template of an interactive data dashboard for the OHI team, which did not exist before. I contributed to furthering the OHI Global Assessments through better documentation as well as improved methodology. I created a website and worked closely in a small group to improve the content and aesthetics of our product for future fellows. I now have a better understanding of mariculture data and fisheries stock assessments, which was an unexpected perk. I accomplished so much over this year with the OHI team that I will continue to foster the OHI workflow and concepts wherever I go.
Related posts