Goals
Goals
The global Ocean Health Index developed 10 goals that encompass ocean health: Food Provision, Natural Products, Clean Water, Coastal Protection, Carbon Storage, Biodiversity, Tourism & Recreation, Livelihoods & Economies, Artisanal Fishing Opportunities, and Sense of Place. These goals for the OHI were adapted from the global framework into 6 goals for ocean health in Hawaiʻi: Food Provision, Coastal Protection, Biodiversity, Sustainable Tourism, Livelihoods & Economies, and Sense of Place. This assessment is for the Main Hawaiian Islands and does not include the Northwestern Hawaiian Islands as these goals assess the sustainable use of our ocean resources as they benefit people now and into the future.
Food Provision: Offshore Fisheries
Goal Description
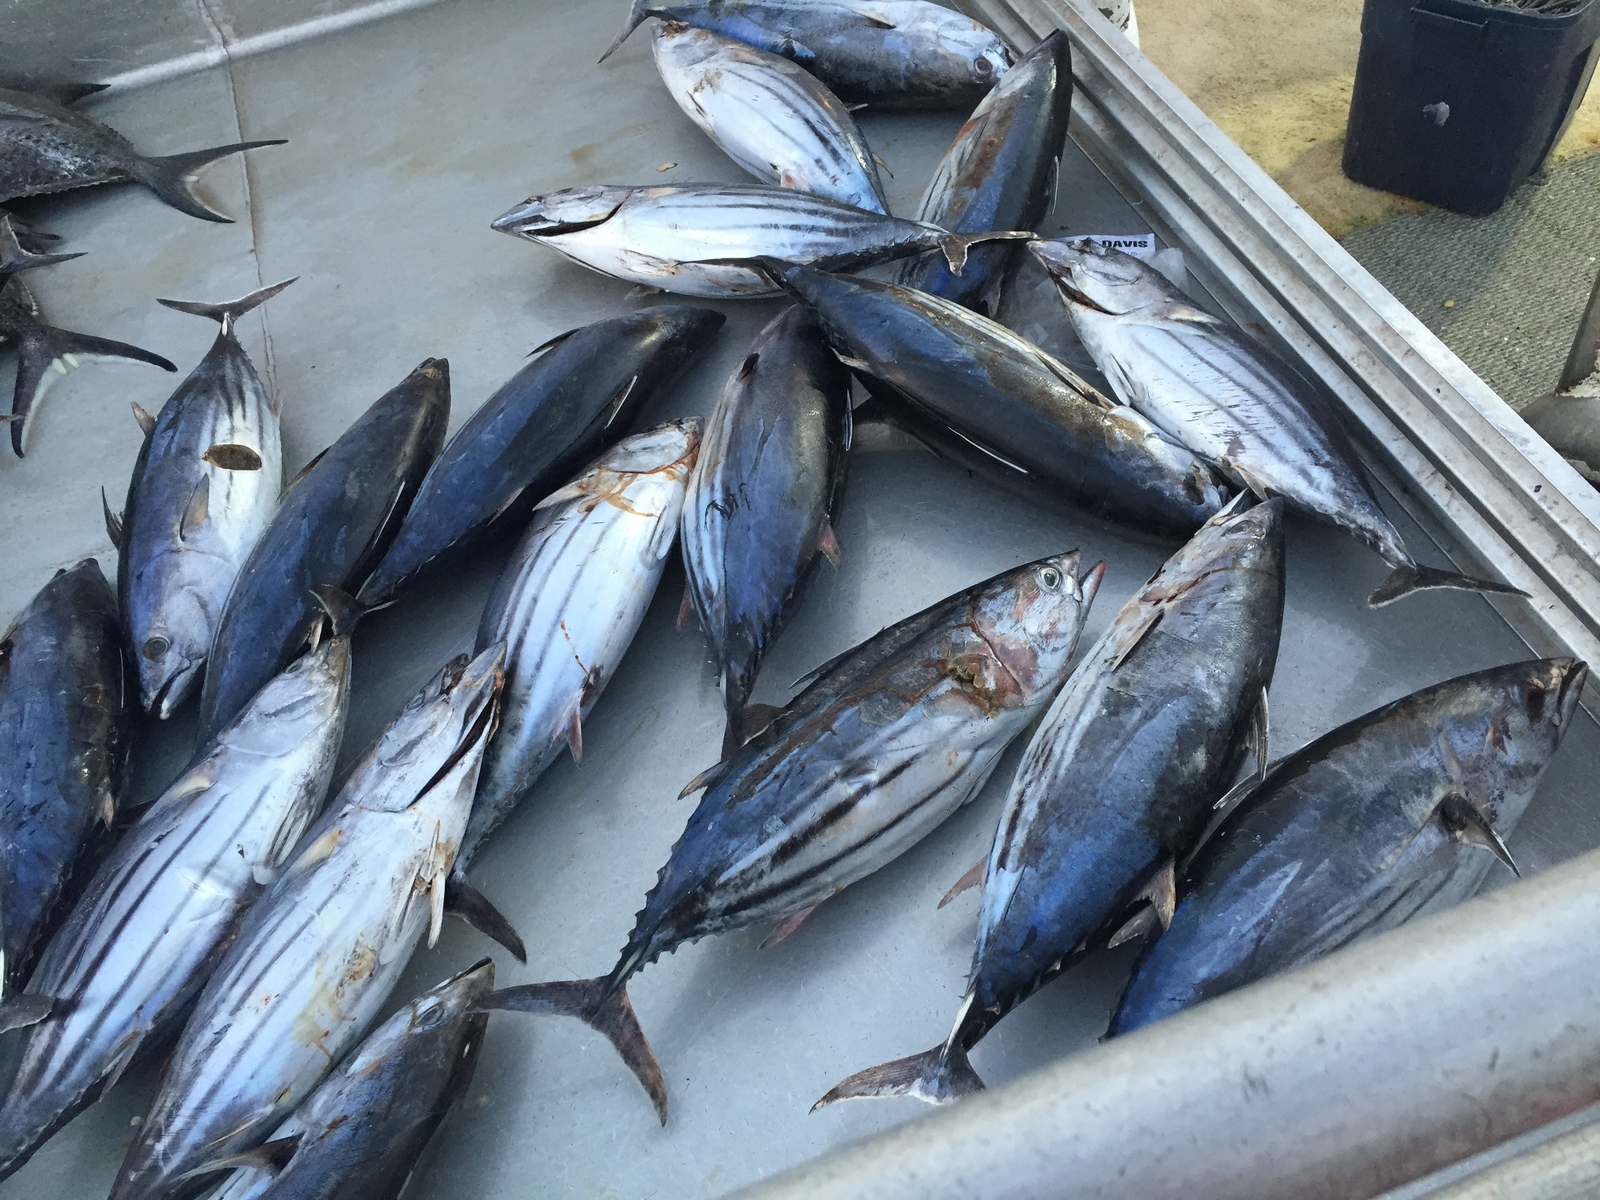
The Offshore Fisheries sub-goal describes the amount harvested and sustainability of Hawaiʻi’s offshore fisheries. The model generally compares landings with Maximum Sustainable Yield. A score of 100 means that the region is harvesting seafood in an sustainable manner. However, it is important to note that this assessment is based on relatively few formal stock assessments and many of the fish species that are included in this assessment lack stock assessments. To include these important fishery species, we made the assumption that the unassessed species within each fishery (pelagic, bottomfish, coastal pelagics) are faring similarly to the assessed fish species.
Model
The model assesses the amount of catch from offshore fisheries (pelagic, coastal pelagic, and bottomfish) that can be sustainably harvested, with sustainability based on formal stock assessments. Each fish species is assessed separately based on sustainability ratios (Biomass at maximum sustainable yeild: B/Bmsy; Spawning biomass at maximum sustainable yield: SB/SBmsy) and weighted by its relative contribution to overall catch. The goal status score for each region in each year was calculated as average scores from each fishery calculated as the mean of the stock status scores for each fishery (pelagic: tuna, swordfish, mahimahi, etc.; bottomfish: deep seven species mainly groupers and snappers; coastal pelagics: jacks, akule, opelu, etc.)
Reference points
Sustainability reference points typically used in formal stock assessments vary by the fishery type in Hawaiʻi. Pelagic fish sustainability reference point is SB/SBmsy set to 1.0. Bottomfish species sustainability reference point is B/BMSY set to 1.0.
Data used in model
Status & trend
commercial coastal pelagic fisheries catch (fis_coast_pelagic_catch): Coastal pelagic fish catch (lbs) reported in the commercial fishery.
bottom fisheries commercial catch (fis_deep_catch): Bottomfish catch (lbs) reported in the commercial fishery.
pelagic fisheries commercial catch (fis_pelagic_catch): Pelagic fish catch (lbs) reported in the commercial fishery.
sustainability of bottomfishery (fis_sus): Bottomfish stock assessment.
sustainability of pelagic fishery (fis_sus): Pelagic (tuna and swordfish) stock assessments.
Food Provision: Nearshore Fisheries
Goal Description
Nearshore fisheries, often also called subsistance fisheries, provides a critical source of food, nutrition, poverty alleviation and livelihood opportunities for many people around the world. In Hawai’i this is the opportunity for fishers to supply seafood for themselves, families, and community. This goal is estimated based the condition of the fisheries resources.
Model
Fisheries resources were measured as the average of 3 components: Reef Fish Biomass, Reef Fish Sustainability, and Reef Fish Predators (NOAA Coral Reef Conservation Program and University of Maryland Center for Environmental Science). Reef Fish Biomass measures the mean biomass of all reef fishes other than sharks and jacks derived from underwater visual surveys of <30m hard bottom habitats. Survey biomass per location is compared against a meaningful local baseline (to account for inherent environmental and habitat differences among locations). High scores therefore represent populations that are close to their natural carrying capacity. Reef Fish Sustainability represents an index of mean size for targeted reef fish species relative to their size at first maturity. High scores therefore represent assemblages where there are still many of large individuals of targets species, those large fishes being particularly important components of the breeding stock. The Reef Fish Predators indicator is made up of 2 components: ‘reef sharks’ and ‘other reef piscivores’ with data taken respectively from towed-diver and point-count surveys by divers. High scores represent locations where upper trophic level fishes are still a conspicuous and ecologically important component of the reef ecosystem.
Reference points
Reference points were set in relation to expected reef fish biomass, reef fish sustainability (fish size), and reef fish predators in relation to ecosystem productivity and without human impacts.
Data used in model
Status & trend
resource (ao_resource): Resource condition was measured through a reef fish indicator. The reef fish indicator is the average of 3 components (Reef Fish Biomass, Reef Fish Sustainability, and Reef Fish Predators).
Food Provision: Mariculture
Goal Description
This subgoal measures the sustainable production potential of seafood from fishponds, known locally as loko ʻia, and current production of seafood weighted by a sustainability score.
Model
The scores are an average of the state reported seafood produciton (mariculture) and fishpond potential.
The species that are reported on the State Department of Land and Natural Resources Division of Aquatic Resources that are produced locally for seafood consumption include: abalone (Haliotus sp), oysters (Crassostrea gigas and Crassostrea sikamea), clams (Venerupis philippinarum), kahala (Seriola dumerili), Pacific white shrimp (Penaeus vannamei), and limu (Gracilaria sp.). Moi (Pacific Threadfin) is not on the State of Hawaii Department of Agriculture list but it is produced locally for out planting in fishponds.
The sustainability of the species produced was assessed as the average of the feed sustainability score (0 protein based, 1 plant based; 0 imported feed, 1 local feed) and the biosecurity risk scored as species status (1 native, 0.75 introduced, or 0 invasive) and the pathogen and virus susceptibility (0 highly susceptible, 0.5 susceptible but preventative measures in place (biosecurity practices such as sterilization and wastewater treatment practices).
The production (lbs of seafood) is reported at the state level to prevent disclosure of sensitive information. To get county level estimates of production the lbs of finfish and shellfish produced at the state level were multiplied by the estimated number of finfish and shellfish operators by county. The number of operators are reported to USDA via census every 5 years (2002, 2007, 2012) (https://www.nass.usda.gov/Statistics_by_State/Hawaii/ ). To fill in annual data gaps linear regression models were used.
Reference points
The mariculture score is calculated as the ratio of the lbs produced by county to the maximum lbs produced within the county over the last 5 year reporting period.The fishpond score is the ratio of the current number of fishponds today to the estimatd number of fishponds reported in 1990 (DHM inc et al., 1990).
Data used in model
Status & trend
number of fishponds in 1990 survey (mar_fishpond_historic): The number of fishponds per county from the 1990 assessment.
number of fishponds (mar_fishpond_numbers): The current number of fishponds.
mariculture yield (mar_harvest): Production of shellfish and food fish from mariculture facilities
operations (mar_operations): The number of mariculture operators.
Coastal Protection
Goal Description
This goal assesses the amount of protection provided by marine and coastal habitats against flooding and erosion to coastal areas. A score of 100 would indicate that these habitats are all still intact or have been restored to their reference conditions, allowing for the full benefits of these habitats to safeguard coastlines.
Model
The model is based on the health of the habitats that provide shoreline protection. Habitats that are included and provide substantial coastal protection are: beaches, coral reefs, and wetlands.
Reference points
Coral Reefs
Coral reef extent was assessed from the cumulative impact mapping layers that combine hard bottom and coral reef habitats to a depth of 30 meters. Coral reef condition was assessed through a coral reef index, which is a measure of coral reef health from combined indicators for coral cover, macroalgae (limu), coralline algae, and the ratio of calcifiers (corals and coralline algae) to non calcifiers (limu), coral mortality, juvenile coral density, and adult coral density. The coral reef index comes from the NOAA Hawai‘i coral reef status report (NOAA Coral Reef Conservation Program and University of Maryland Center for Environmental Science). Trend in coral reef health is the recent (5 year) trend in coral cover and was assessed as the change in coral cover from 2011-2012 to 2016 surveys from the Main Hawaiian Islands (McCoy et al., 2017).
Beaches
Beach erosion is expected to increase with climate change and sea level rise, reducing coastal protection ability of beaches in Hawai‘i.Beach condition was measured as the percent of beaches remaining stable (not eroding). The beach trend is the long term erosion rate (past century) calculated from Fletcher et al. 2012.
Wetlands
Wetland condition was measured as the percent loss of historical coastal wetlands (Van Rees and Reed 2014). Wetland extent was assessed from National Oceanic and Atmospheric Administration Coastal Change Analysis Program (NOAA C-CAP) data clipped to within 1 km inland from the coast to capture coastal wetlands extent. All estuary categories were included in this assessment that were within 1km of the coastline as these habitats within 1km of the shoreline will mitigate against flooding and wave inundation. NOAA C-CAP surveys are repeated every 5 years to measure changes in land cover. The trend in coastal wetlands was assessed as the difference in coastal wetland extend from 1992 to 2011.
Data used in model
Status & trend
reef condition (cp_hab_condition): The benthic condition of coral reefs assessed through a combination of variables including percent coral cover, percent macroalgae cover, demography, and mortality.
reef condition (cp_hab_condition): The benthic condition of coral reefs assessed through a combination of variables including percent coral cover, percent macroalgae cover, demography, and mortality.
beach condition (cp_hab_condition): The condition of coastal habitats measured as the percent of beaches eroding per region.
coastal wetland condition (cp_hab_condition): Wetland condition was calculated based on percent of historical extent.
reef extent (cp_hab_extent): The hardbottom extent out to 80 meters modified from NOAA habitat maps.
beach extent (cp_hab_extent): Beach extent was calculated from the from ESI GIS layer (Beaches (3,4,5 classifications)). The data units are in km not km2 like other habitats.
coastal wetland extent (cp_hab_extent): The area of coastal wetlands (within 1 km of the coastline).
wetland trend (cp_hab_trend): The annual percent change in wetland extent based on NOAA C-CAP data comparisons from 2005 to 2010/2011 clipped to 1 km from the shoreline.
beach trend (cp_hab_trend): The average short-term erosion rate of beaches, estimated at -0.06 m per year.
reef trend (cp_hab_trend): The estimated change in percent coral cover calculated from the past 5 years of available monitoring data from NOAA Ecosystem Program.
Sustainable Tourism
Goal Description
This goal strives to measure the balance between economic growth through tourism with management and preservation of natural resources and Hawaiian culture. This is measured through tracking ocean and coastal management areas to preserve the environment and provide visitor ecotourism opportunities and the sentiment of residents of tourism.
Model
Sustainable tourism was calculated as the average of three components: economic benefit, resident sentiment, and protection of coastal and nearshore areas.
Economic benefit was was scored based on two indicators of the economic contribution of visitors to Hawaiʻi: 1. Annual visitor expenditures and 2. Averge daily visitor spending. These indicators reflect Hawaii’s economic reliance on visitor spending and recognize the stakeholder identified need to reduce the social and environmental impact of visitors while maintaining visitor generated revenue through increased visitor spending and while maintaining or decreasing the annual number of visitors. Visitor expenditures were adjusted by inflation by the implicit price deflator (DBEDT 2016) . The reference level for visitor contribution to economic growth was set at 2.5% annual growth rate (HTA, 2016). Visitor generated total expenditures was estimated to county level by weighting expenditures by the average daily number of visitors to each county (visitors defined as overnight stays (DBEDT 2016)). Average daily visitor spending was assessed as the annual percent change in visitor spending.
Sentiment scores the preservation of social and cultural values estimated though HTA visitor sentiment surveys. Three questions have been asked consistently and thus have time-series information and were used to score the agreement or sentiment of residents on the benefits and impact of tourism in Hawaiʻi. The three questions were to rate the level of impact and agreement on: 1. Rate the overall impact of tourism on your family, 2. Tourism has brought more benefits than problems, and 3. The island is being run for the tourists at the expense of the local people. The three questions were normalized for a score of 0 to 100 with 100 being positive or agreement on positive impacts of tourism for residence of Hawaii. Questions were averaged and scored to a reference value of 80% as set by the Hawaiʻi Tourism Authority as their target acceptance rate (HTA 2016 Annual Report).
Environment scores the protection of the natural environment including ocean areas (Marine Protected Areas, Community Subsistence Fishing Areas, NOAA Sanctuary Areas) and coastal conservation areas. Ocean area protection data comes from the Aloha+ dashboard on marine managed areas with a reference rate of 30% nearshore areas effectively managed by 2030. Coastal conservation areas (referred to as coastal conservation districts) have vairying conservation protection and are weighted by protective ability.
Reference points
The reference level for visitor contribution to economic growth and visitor spedning was set at a 2.5% annual growth rate.
The sentiment reference level was set to 80%.
The coastal and nearshore ocean areas reference level was set to 30% of total nearshore and coastal area for each region.
Data used in model
Status & trend
environmental protection (t_env_sus): The percent of nearshore areas priority watersheds protected in reference to Hawaii Sustainability Initiatives (30 by 30 targets). This data may change as the State DLNR Division of Aquatic Resources develops the 30 by 30 initiative.
visitor contributed GDP (t_growth): Visitor generated GDP with a target set by the Hawaii Tourism Authority of 2.5% annual growth.
resident sentiment (t_sentiment): The Hawaii Tourism Authority’s survey on resident sentiment to tourism.
average daily visitor spending (st_visitor_spending): Annual percent change in daily visitor spending
Livelihoods & Economies: Livelihoods
Goal Description
The jobs and revenue produced from marine-related industries are clearly of huge value to many people, even for those people who do not directly participate in marine-related industries. People value community identity, tax revenue, and indirect economic and social impacts of a stable coastal economy. This sub-goal, Livelihoods, describes job quantity and quality for people living on the coast. Livelihoods includes two equally important sub-components, the number of jobs, which is a proxy for livelihood quantity, and the per capita average annual wages, which is a proxy for job quality.
Model
The Livelihood model is based on job and wage data:
- Jobs: The total number of jobs within marine sectors within a region, adjusted by sector- and development status-specific multipliers derived from DBEDT 2007 (http://files.hawaii.gov/dbedt/economic/reports/IO/2007_state_io_study.pdf). The multipliers account not only for direct employment opportunities and revenue, but also indirect and induced economic effects, since activity in the direct industry stimulates additional jobs and revenue in related industries.
- Wage: The average wage for each marine sector.
The marine sectors included in this model are: Marine Construction, Living Resources, Ship and Boat Building, Tourism and Recreation, and Marine Transportation.
Reference points
Because there is no absolute reference point for jobs (i.e., a target number of jobs would be completely arbitrary), its reference point is calculated as a relative value on a moving baseline: the value in the current year (or most recent year) relative to the value in a recent moving reference period, defined as 5 years prior to the current year. This reflects an implicit goal of maintaining coastal livelihoods and economies on short time scales, allowing for decadal or generational shifts in what people want and expect for coastal livelihoods and economy.
The reference value for average annual wages for each ocean sector was referenced to the state average wage and weighted by the proportion of jobs per sector.
Data used in model
Status & trend
ocean and coastal jobs (le_jobs): The total number of jobs per ocean sector for each county.
resident population (le_popn): The number of residents per county.
unemployment (le_unemployment): The unemployment rate.
ocean and coastal sector mean wages (le_wage): The mean wage per ocean sector by county
workforce (le_wkforce): The total number of jobs per county.
Hawaii average wage (liv_a_wage): The Hawaii average annual wage by county
Livelihoods & Economies: Economies
Goal Description
Economies captures the economic value associated with marine industries using revenue from marine sectors. It is composed of a single component, revenue.
Model
The model assesses revenue from these marine sectors: Marine Construction, Living Resources, Ship and Boat Building, Tourism and Recreation, and Marine Transportation.
Revenue is adjusted by sector- and development status-specific multipliers derived from the literature to account not only for direct revenue, but also indirect and induced economic effects, since activity in the direct industry stimulates additional jobs and revenue in related industries.
Reference points
Because there is no absolute reference point for revenue (i.e., a target number of revenue would be completely arbitrary), its reference point is calculated as a relative value on a moving baseline: the value in the current year (or most recent year) relative to the value in a recent moving reference period, defined as 5 years prior to the current year. This reflects an implicit goal of maintaining coastal livelihoods and economies on short time scales, allowing for decadal or generational shifts in what people want and expect for coastal livelihoods and economy.
Data used in model
Status & trend
ocean and coastal revenue (le_gdp): The revenue generated per ocean sector for each county.
Sense of Place
Goal Description
Sense of Place measures the relationship that people have with the ocean and coastal areas. How we use ocean areas can in part define our connection and values towards them. There were many very valuable suggestions on how to measure Sense of Place including the use and knowledge of Hawaiian place names. Hawaiian names often reflect the activities, history, and the environment of the place. Unfortunately, there was no available and consistent way to measure the use of Hawaiian place names. This is a data gap and need that was identified during the development process for this goal. Therefore, Sense of Place was measured through activities that take place in each place, assessed as the participation rate in ocean and coastal activities.
Model
Participation in ocean activities was collected across the state by the NOAA Coral Reef Conservation Program socioeconomic surveys of human use, knowledge, attitudes, and perceptions in Hawaii (NOAA 2014).
Reference points
Participation in a coastal ocean recreational or cultural activity at least once per month. ### Data used in model
Status & trend
participation in recreational activities (con_participation): The NOAA Coral Reef Conservation Program 2014 socioeconomic surveys of human use, knowledge, attitudes, and perceptions in Hawaii.
Biodiversity: Species
Goal Description
People value biodiversity in particular for its existence value. The risk of species extinction generates great emotional and moral concern for many people. As such, the Biodiversity goal assesses the conservation status of species based on assessments of fish, marine mammals, turtles and birds, and coastal plants.
Model
Hawaiʻi has a high rate of endangered species. The latest assessment lists 501 Endangered species (77 animal) (Environmental Conservation Online System 02/13/2015). The Endangered Species Act (ESA) was established in 1973 provides for the conservation of species that are endangered or threatened (likely to become endangered in the near future without protection) throughout all or a significant portion of their range, and the conservation of the ecosystems on which they depend. To assess species status, we combined information on local reef fish species status indicators (NOAA report card/ HMARC), and ESA status of marine mammals, turtles, and birds, and coastal plants. We incorporated reef fish indicators even though many of Hawaiʻi’s reef fish are not considered threatened or endangered. Local indicators of reef fish populations and status are important for understanding the health of coral reefs and biodiversity and therefore were included through a reef fish indicator.
The reef fish indicator measures the average of 3 components: Reef Fish Biomass, Reef Fish Sustainability, and Reef Fish Predators (NOAA Coral Reef Conservation Program and University of Maryland Center for Environmental Science). Reef Fish Biomass measures the mean biomass of all reef fishes other than sharks and jacks derived from underwater visual surveys of <30m hard bottom habitats. Survey biomass per location is compared against a meaningful local baseline (to account for inherent environmental and habitat differences among locations). High scores therefore represent populations that are close to their natural carrying capacity. Reef Fish Sustainability represents an index of mean size for targeted reef fish species relative to their size at first maturity. High scores therefore represent assemblages where there are still many of large individuals of targets species, those large fishes being particularly important components of the breeding stock. The Reef Fish Predators indicator is made up of 2 components: ‘reef sharks’ and ‘other reef piscivores’ with data taken respectively from towed-diver and point-count surveys by divers. High scores represent locations where upper trophic level fishes are still a conspicuous and ecologically important component of the reef ecosystem.
Reference points
All marine mammals, turtles, and coastal plants are not threatended or endangered. Reef fish biomass is equal to the local baseline for fish biomass (natural carrying capacity). Reef fish harvest is sustainable with large, reproductively mature fish represented in the local populations. Reef fish predators (sharks and piscivores) are present and close to baseline conditions (abundance and biomass before human impacts).
Data used in model
Status & trend
fish indicator (spp_fish): The reef fish indicator is the average of 3 components (Reef Fish Biomass, Reef Fish Sustainability, and Reef Fish Predators).
ESA coastal plant status (spp_status): The list of Hawaii coastal plant species and status of coastal sand-dune plants scored based on ESA status.
ESA marine mammal status (spp_status): The list of marine mammals found in Hawaii and status of marine mammals scored based on ESA status.
ESA seabird and coastal bird status (spp_status): The list of seabirds and coastal birds scored based on ESA status and State of the Birds watch lists.
Biodiversity: Habitats
Goal Description
The Habitats sub-goal of Biodiversity measures the extent and condition of ocean and coastal habitats.
Model
The habitat model assessed all habitats for which data were available to evaluate extent and condition, specifically: coral reefs, coastal wetlands, beaches, and subtidal soft-bottom habitats. Status was calculated as the average of the condition estimates for each habitat present in a region, measured as the loss of habitat and/or percent degradation of remaining habitat.
Reference points
Coral Reefs
Coral reef condition was assessed through a coral reef index, which is a measure of coral reef health from combined indicators for coral cover, macroalgae (limu), coralline algae, and the ratio of calcifiers (corals and coralline algae) to non calcifiers (limu), coral mortality, juvenile coral density, and adult coral density. The coral reef index comes from the NOAA Hawai‘i coral reef status report (NOAA Coral Reef Conservation Program and University of Maryland Center for Environmental Science). Trend in coral reef health is the recent (5 year) trend in coral cover and was assessed as the change in coral cover from 2011-2012 to 2016 surveys from the Main Hawaiian Islands (McCoy et al., 2017).
Beaches
Beach erosion is expected to increase with climate change and sea level rise, reducing coastal protection ability of beaches in Hawai’i.Beach condition was measured as the percent of beaches remaining stable (not eroding). The beach trend is the long term erosion rate (past century) calculated from Fletcher et al. 2012.
Wetlands
Wetland condition was measured as the percent loss of historical coastal wetlands (Van Rees and Reed 2014). Wetland extent was assessed from National Oceanic and Atmospheric Administration Coastal Change Analysis Program (NOAA C-CAP) data clipped to within 1 km inland from the coast to capture coastal wetlands extent. All estuary categories were included in this assessment that were within 1km of the coastline as these habitats within 1km of the shoreline will mitigate against flooding and wave inundation. NOAA C-CAP surveys are repeated every 5 years to measure changes in land cover. The trend in coastal wetlands was assessed as the difference in coastal wetland extend from 1992 to 2011.
Subtidal Softbottom
Near shore softbottom habitat extent was mapped to a depth of 100 meters. The condition was measured as the proportion of soft bottom habitat that was not dredged. Dredging was defined as activity involving physically removing substrate with machinery typically to allow for safe passage of vessels (http://www.pacioos.hawaii.edu/projects/oceantippingpoints/#data).
Data used in model
Status & trend
soft bottom extent (hab_extent_mhi): Soft bottom habitat extent was derived from the cumulative impact habitat maps.
reef extent (hab_extent_mhi): The hardbottom extent out to 80 meters modified from NOAA habitat maps.
beach extent (hab_extent_mhi): Beach extent was calculated from the from ESI GIS layer (Beaches (3,4,5 classifications)). The data units are in km not km2 like other habitats.
coastal wetland extent (hab_extent_mhi): The area of coastal wetlands (within 1 km of the coastline).
soft bottom condition (hab_health_mhi): The percent of softbottom habitat not impacted by dredging.
beach condition (hab_health_mhi): The condition of coastal habitats measured as the percent of beaches eroding per region.
wetland condition (hab_health_mhi): Wetland condition was calculated based on percent of historical extent.
soft bottom trend (hab_trend_mhi): Trend was not evaluated for soft bottom habitats.
wetland trend (hab_trend_mhi): The annual percent change in wetland extent based on NOAA C-CAP data comparisons from 2005 to 2010/2011 clipped to 1 km from the shoreline.
beach trend (hab_trend_mhi): The average short-term erosion rate of beaches, estimated at -0.06 m per year.
reef trend (hab_trend_mhi): The estimated change in percent coral cover calculated from the past 5 years of available monitoring data from NOAA Ecosystem Program.