Explore OHI Global Data & Data Gaps for Samoa
Objectives
Following the OHI Global Goal Models, Data, and Gaps presentation, let’s explore the OHI Global data for Samoa.
Gapfilling in Samoa
Let’s look a bit deeper to see numerically the percent gapfilling by goal to help us prioritize which goals we want to explore more deeply. We can pull directly from the data from the Frazier et al. 2015 publication.
It’s interesting to compare the percent gapfilling by goal to the scores by goal. Let’s look at this both as a table and as a figure and discuss what you see.
Table: % Gapfilled vs. Scores
Here is this information as a table.
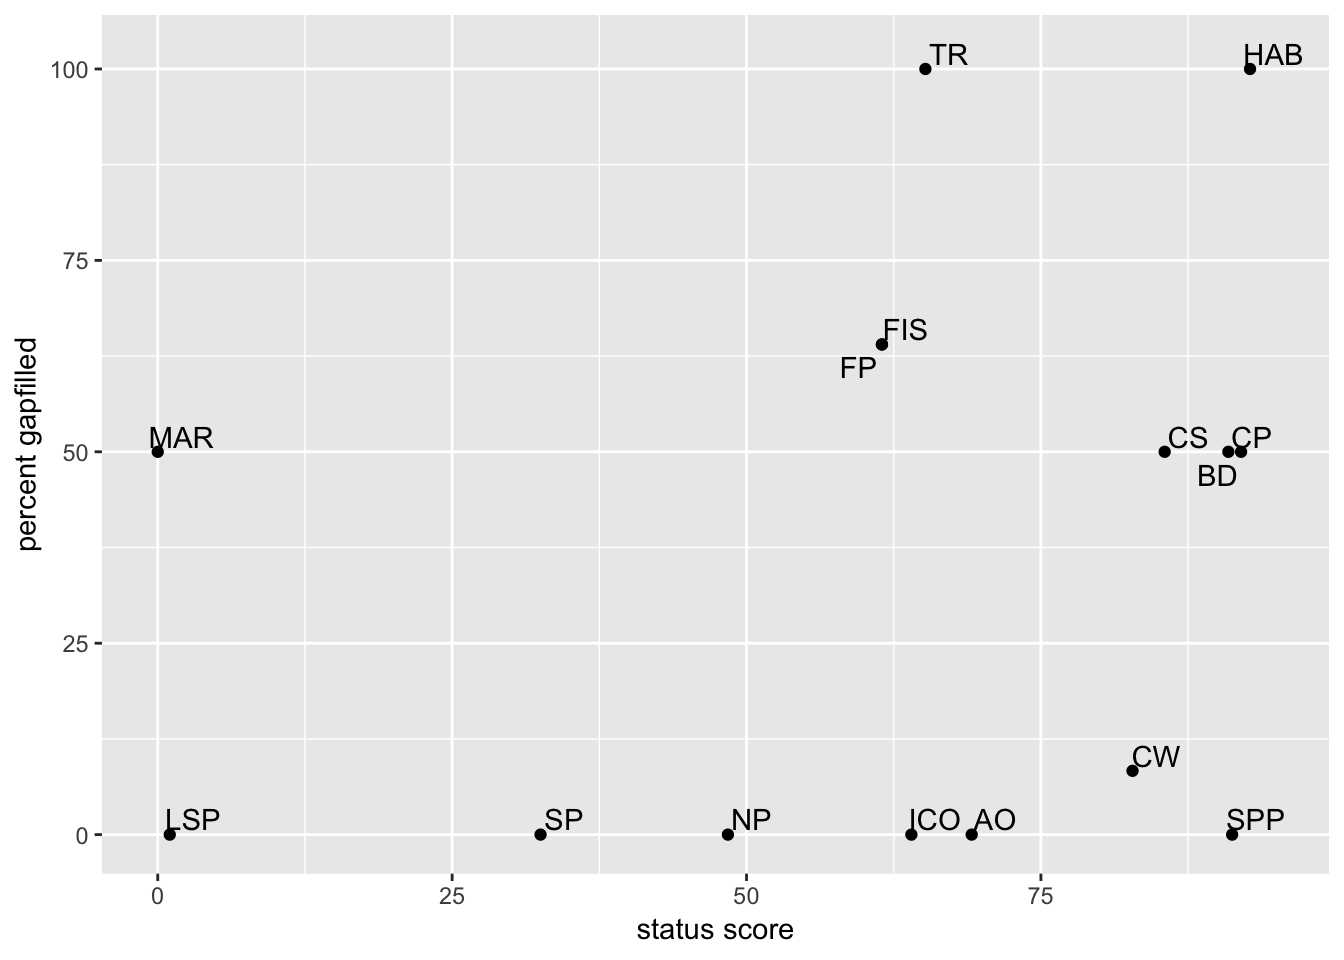
Figure: % Gapfilled vs. Status Scores
It can also be nice to see it as a figure. There are a few places where there are overlaps because goals have the exact same scores.
Gapfilling Observations
Let’s brainstorm together: let’s list overall observations and observations by goal. Then we will prioritize which to dive deeply into and look at the underlying data with the time we have.
Here are some of the things that we discussed, I’ll update this to include everything we talked about.
Overall
Observations:
- Two goals are 100% gapfilled (TR, HAB)
- Samoa has a lot of goals (~11) with scores over 50 (on the x-axis)
- There are ~7 goals where % gapfilling is under 12.5% (on the y-axis)
- Some high-scoring goals have high % gapfilling, some have low
Tourism and Recreation (TR)
Observations:
- TR has the highest amount of gapfilling compared to any goal.
Habitat-based goals (HAB, CS, CP)
Observations:
- HAB is the goal with the highest amount of gapfilling and highest score
- CP, CS, and HAB rely on much of the same data.
Food Provision (FP)
Observations:
- FP and FIS are plotted on top of each other, which means that the FP score is the same as FIS (we can also see this from the table above). This means that MAR contributes nothing to the FP score, and in fact the MAR score is 0.
Lasting Special Places (LSP)
Observations:
- LSP has a very low score, and is not gapfilled.
Species-based goals (ICO, SPP)
- these scores are quite high and are not gapfilled (0).
Artisanal Fishing Opportunities (AO)
Observations:
- This is not gapfilled, meaning that the data was not gapfilled by OHI. Data for access comes from survey data (Mora et al) and need comes from GDPpcPPP as a proxy for subsistence fishing need (World Bank).
Livelihoods and Economies (LE, LIV, ECO)
Observations:
- The LE goal is not on the figure. We didn’t include them in our gapfilling analyses because our models rely on old data (pre-2012).
Now, where should we start? What order should we discuss these?
Data discussion: deep dive
Let’s look into the data behind some of these goals.
We will use several resources for each goal, all linked from ohi-science.org/ohi-global:
- ohi-science.org/ohi-global/goals
- ohi-science.org/ohi-global/layers_table.html
- Global supplemental information
Food Provision: Fisheries
Questions:
- Which species are included in the FIS calculation? Where do the data come from?
Global Data
Global data are from the Sea Around Us Project. Many species do not have formal stock assessments, but they do have tons of catch through time. The criteria we use for our fisheries model is data that has:
- catch by species: only what is fished within Samoa’s EEZ
- years: at least 10 years of data (preferably 20)
We can look at these data in several ways. Let’s start by looking on SAUP’s website at an interactive visualization of fish caught in Samoa’s EEZ:
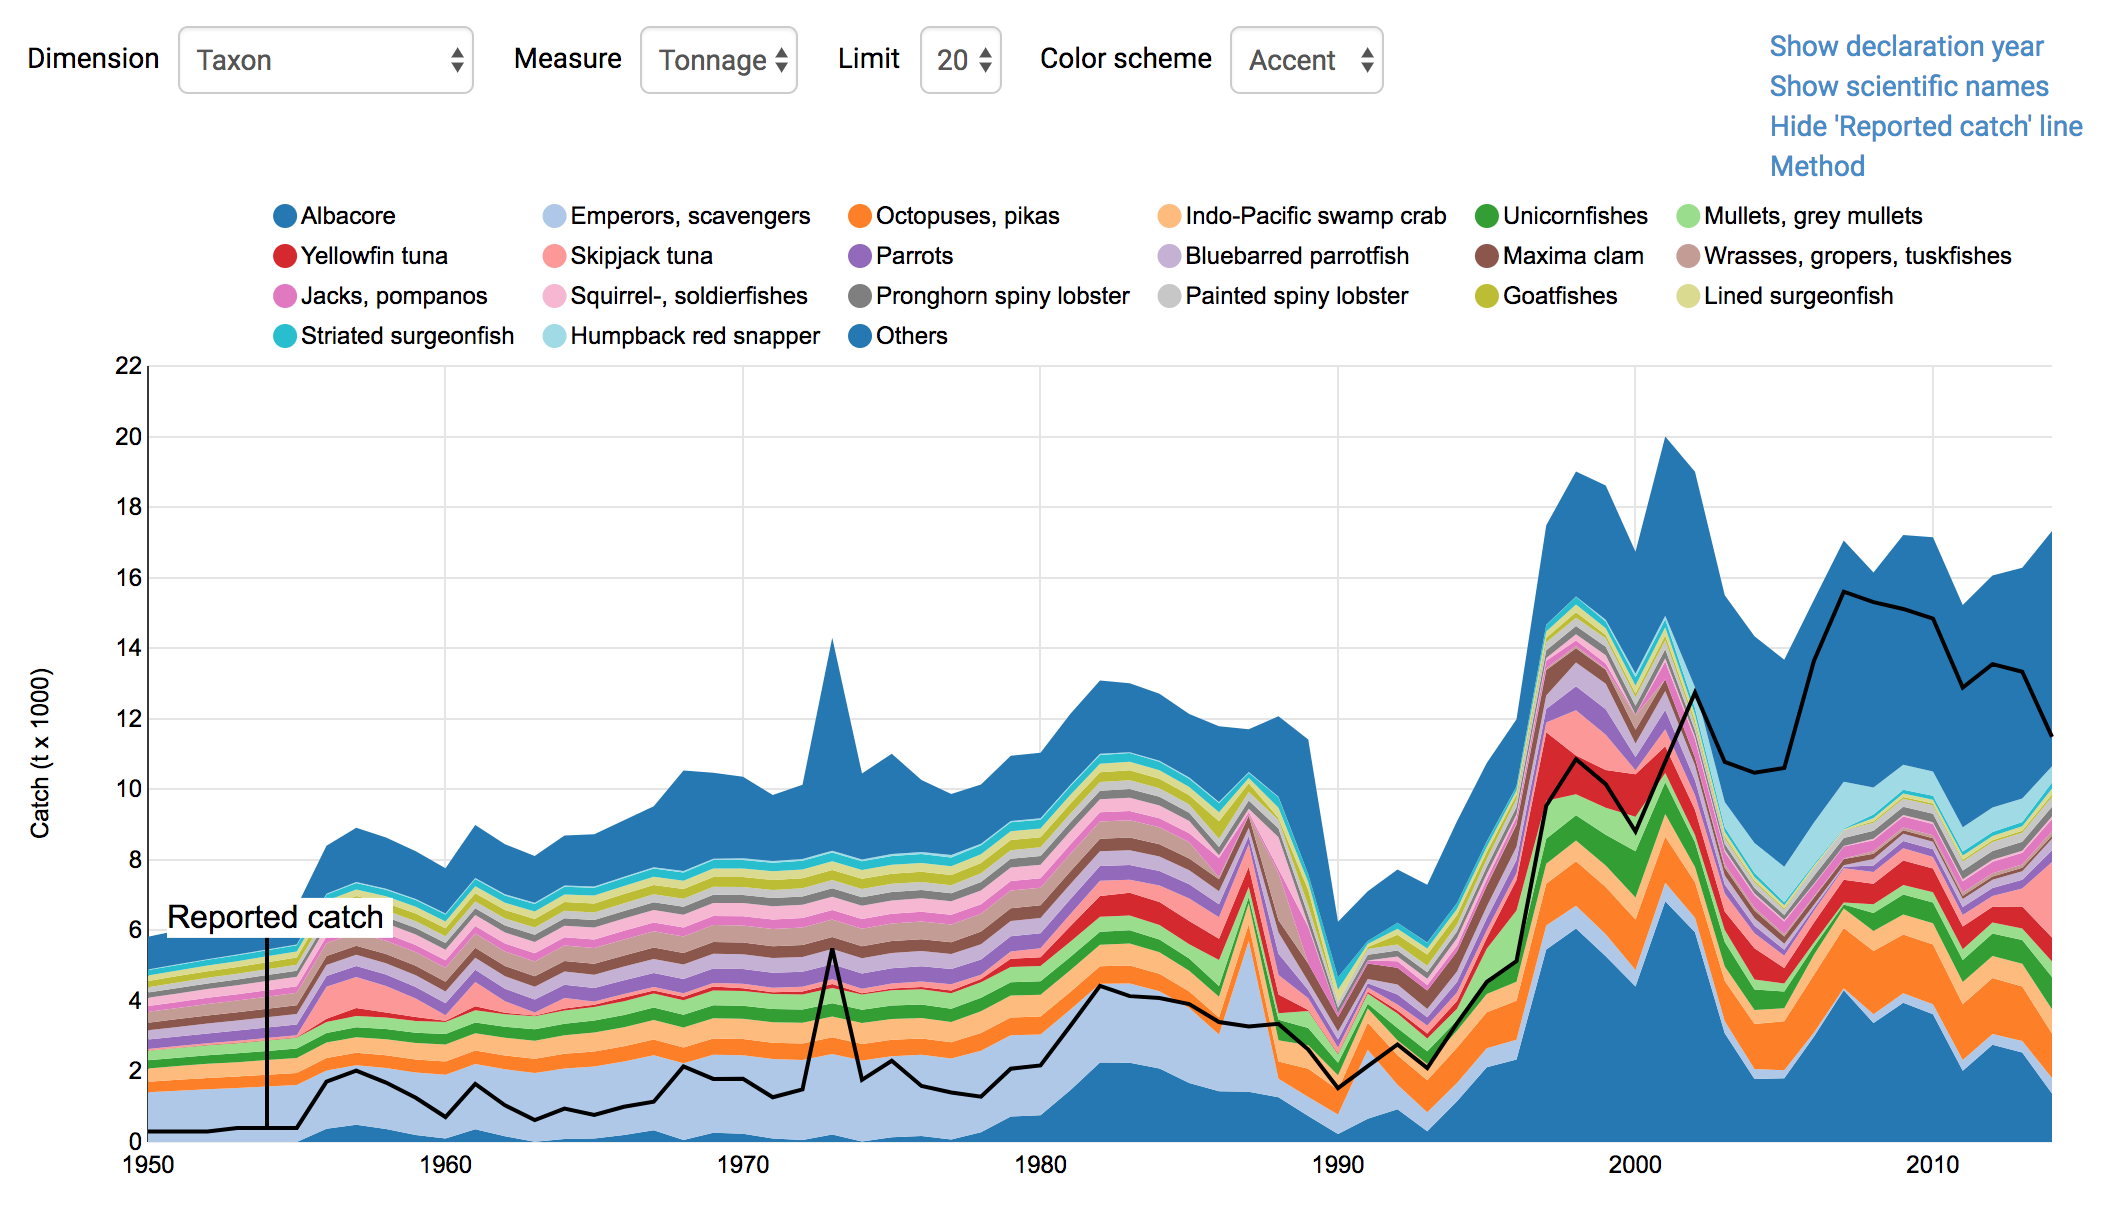
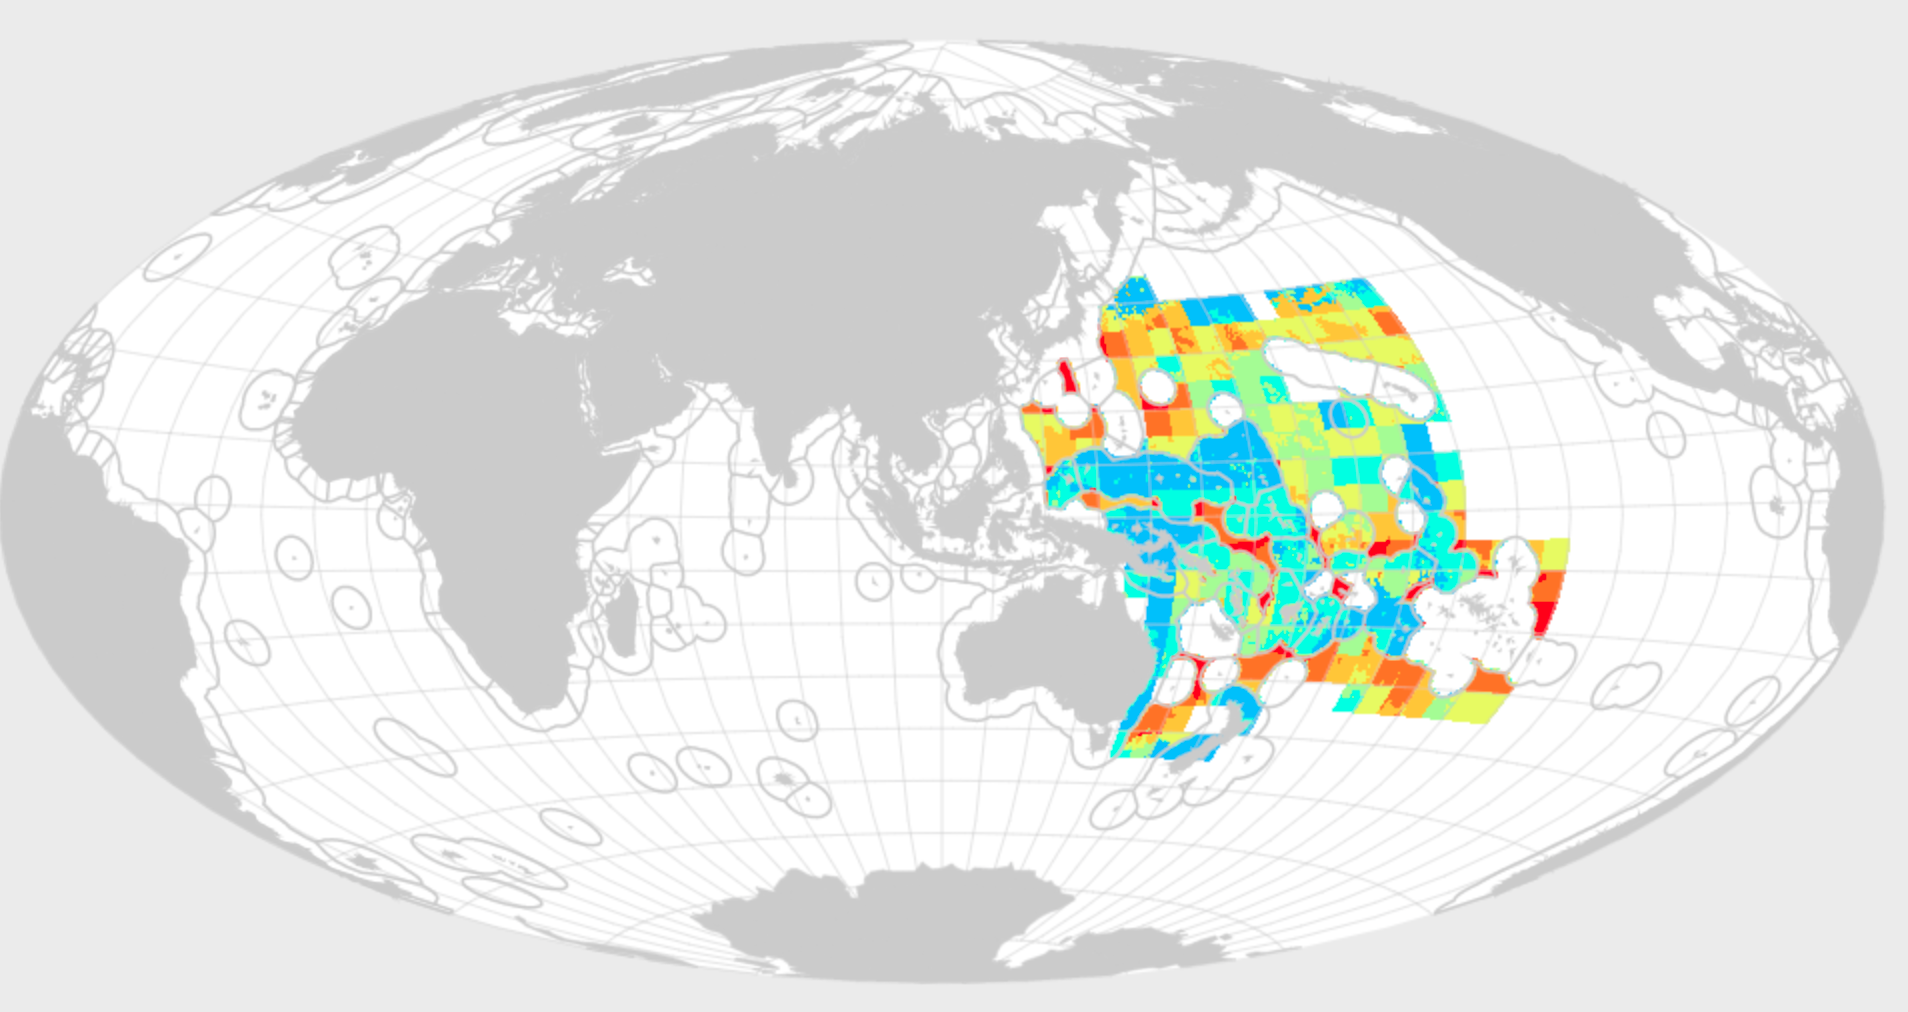
We can also look at an interactive visualization of Samoa fishing around the world (mostly high seas and agreements with other countries). So although Samoa fishes further than its own EEZ, we don’t include a lot of that catch.
Let’s look through the species listed and see if there are any included that don’t represent Samoa’s fisheries within the EEZ; we can remove them (but we can’t add additional species in this workshop).
Then, we can look at the mean catch estimates for certain species, especially for catch that is grouped instead of by species. If better local data are available, we can try to substitute these data.
Mean catch
The mean catch layer (fis_meancatch) is in some ways a historic list because it includes species that may not be caught any more (i.e. was fished in the past and stopped for some reason). It is calculated as the average (mean) of each species’ catch through time, so if it was a big catch in the past but now is 0, it will still average (it keeps all species in the dataset).
It will be more useful for us to look at the raw catch values, and see if any of them don’t seem right.
Raw catch data
To understand mean catch, dive into catch by species.
Let’s do two things. First, look through the list of species to see if any of them should be removed.
There are 78 unique species.
Let’s look at them in the presentation since there are so many.
Do we want to look at the timeseries for any species? For example:
B/Bmsy
These are the species stocks that we have data for fis_b_bmsy:
Let’s also look at these in the presentation.
There are only 14 species in the fis_b_bmsy layer for Samoa.
Let’s look at these too. Are there any species that don’t seem right?
Discussion
- Are there any species that don’t seem right and we should remove, for meancatch or B/Bmsy?
- There are many categories that we only have information at the genus or family levels. Do you have information for species level?
Food Provision: Mariculture
Questions:
- Why is the MAR score 0?
Global Data
Tonnes of Harvest
Let’s look at the list of species that are represented in the MAR model as tonnes of harvest: (the mar_harvest_tonnes layer).
***Note! In 2018 Seaweed will also be included if this is reported for Samoa)
So there are only 5 species reported to FAO, and they are all clams.
Let’s have a peek at the data:
Discussion
- are better data available for these species?
- are there other species that should be represented in Samoa?
Lasting Special Places
The model measures the percentage of coastal marine protected area and protected coastline in each country, against a reference percentage. We focus only on coastal waters (within 3nmi of shore) for marine special places because it was assumed that lasting special places are primarily in coastal areas; we wanted our estimates of % area protected to be bounded to this coastal region. For coastlines, we focused only on the first km-wide strip of land as a way to increase the likelihood that the area being protected by terrestrial parks is connected to the marine system in some way.
Global Data
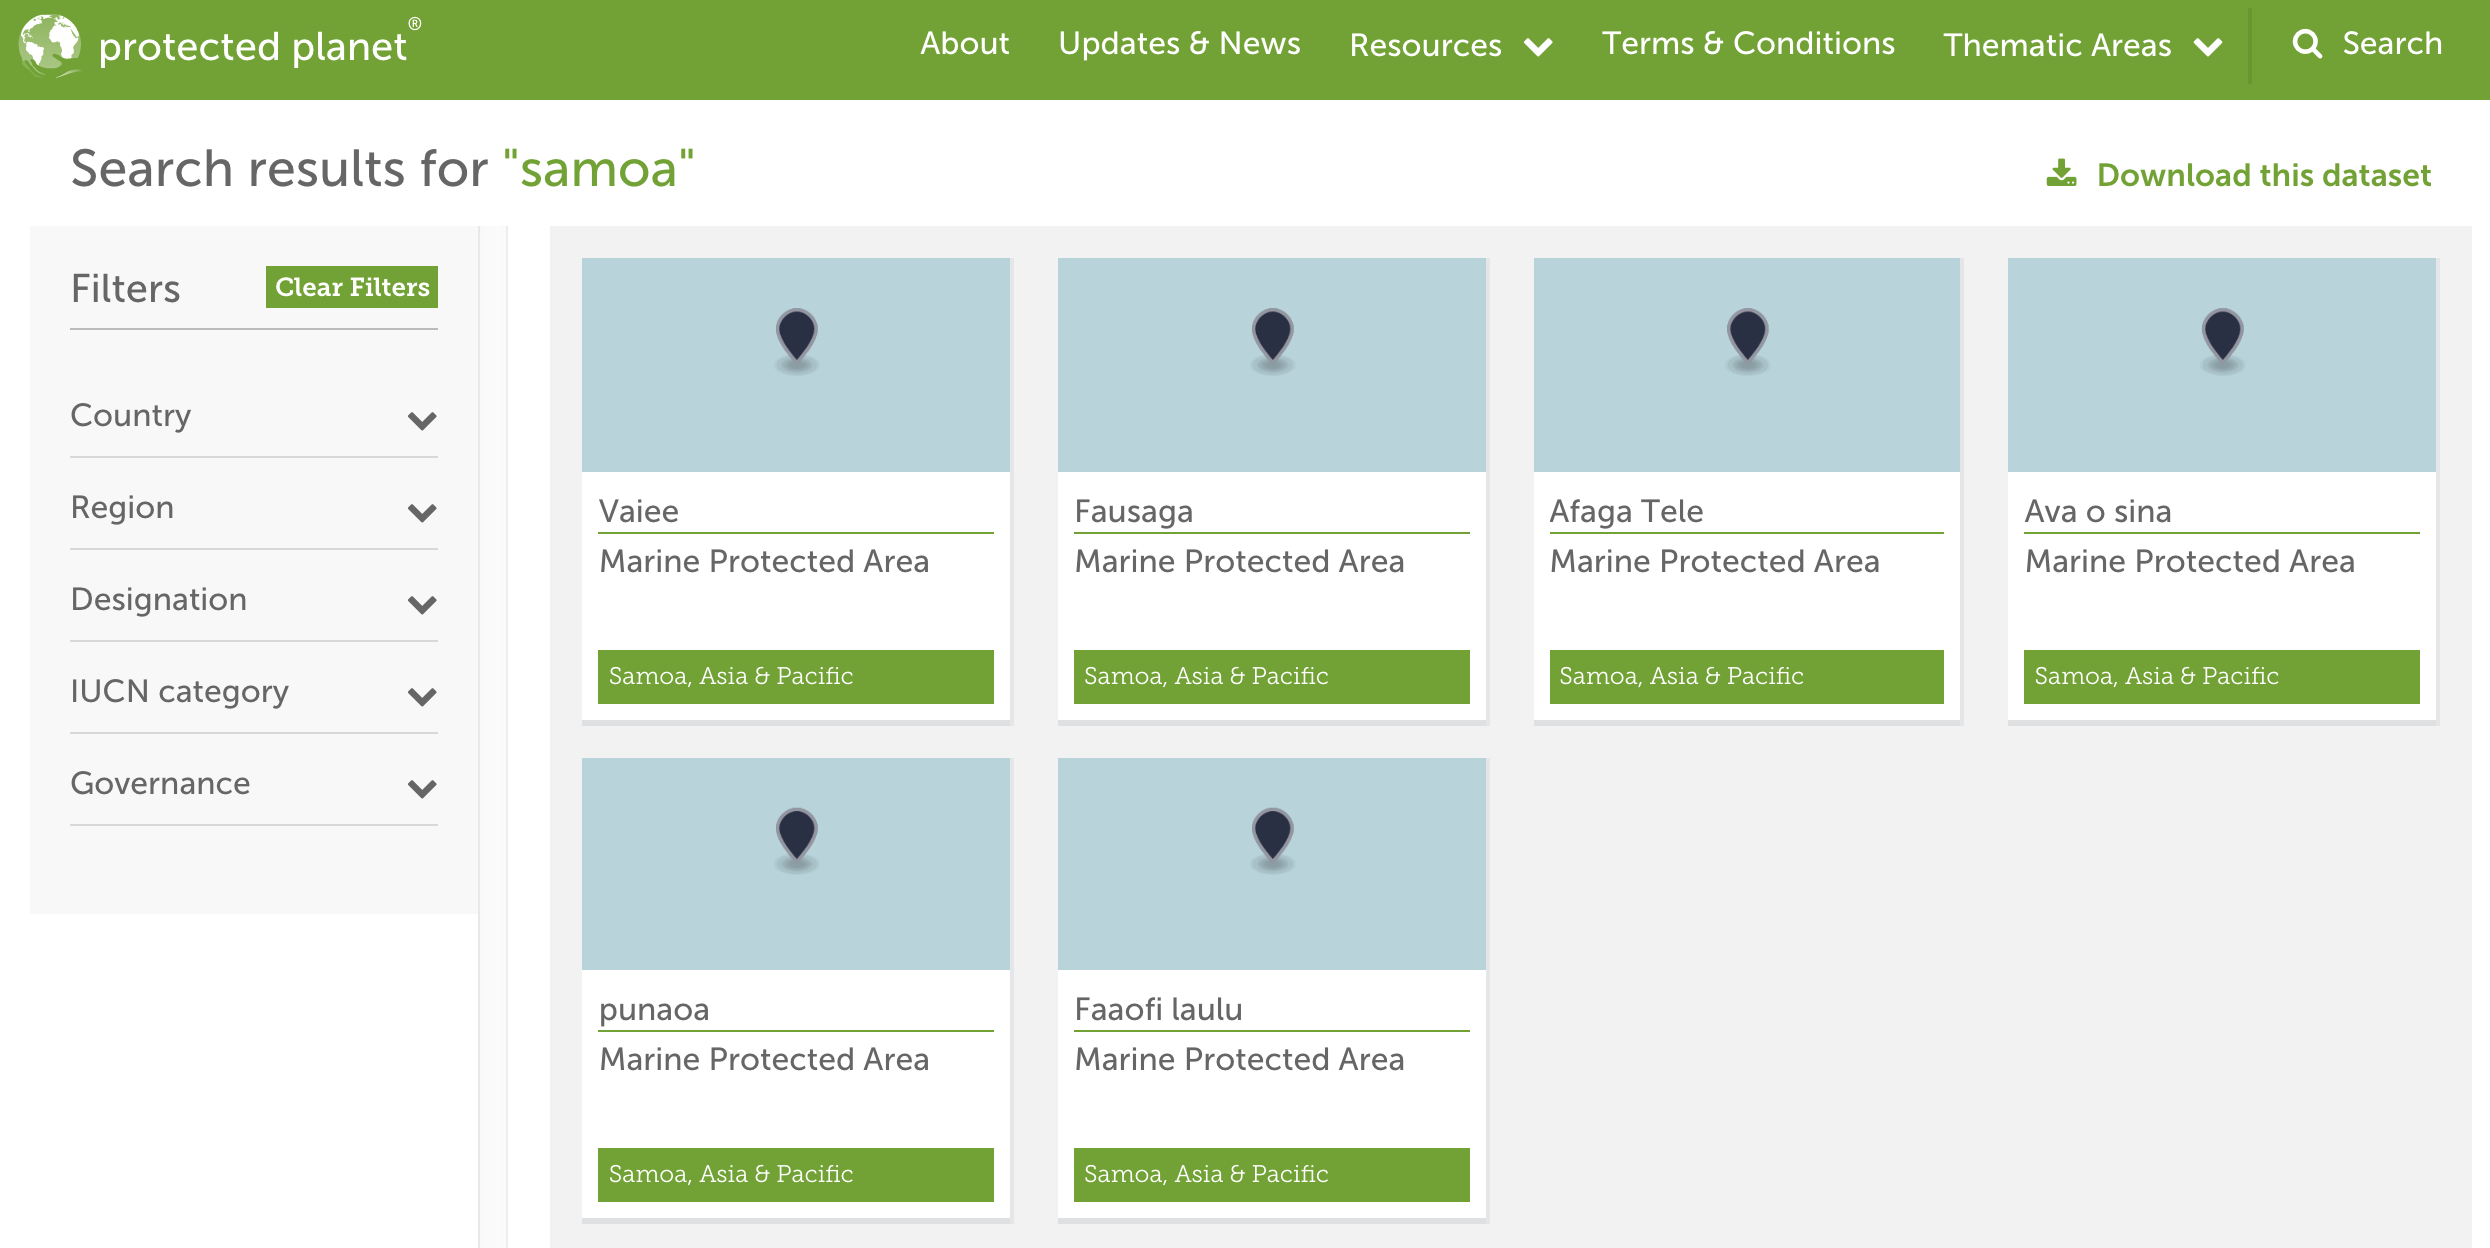
Data is from the United Nations Environment Programme - World Conservation Monitoring Centre’s World Database on Protected Areas: protectedplanet.net.
Data details:
- includes all nationally designated (e.g., National Parks, Nature Reserves)
- includes internationally recognized protected areas (e.g., UNESCO World Heritage Sites, Ramsar Wetlands of International Importance)
- includes WDPA polygons only (excludes points)
- includes status of “designated” only (excludes “proposed”)
The model measures the percentage of coastal marine protected area and protected coastline in each country, against a reference percentage (30%).
There is a lag in the WDPA database, as discussed in this article. Therefore, Samoa may not have been included in previous datasets.
Let’s have a look at the data available now (I downloaded it as a CSV):
Discussion
are there other coastal or marine parks that are not accounted for? Discuss reporting, etc.
an example of adding data to LSP is available here (run from the master branch)
Habitat-based goals
Questions:
- Which habitats are heavily gapfilled in HAB? (Or, which are not gapfilled in CP, CS?)
Global Data
Carbon Storage: 3 coastal habitats: mangroves, seagrasses, and salt marshes
Coastal Protection: 5 coastal habitats: mangroves, seagrasses, salt marshes, coral reefs, and sea ice (although not in Samoa!)
Habitats (BD sub-goal): 6 coastal habitats: mangroves, seagrasses, salt marshes, coral reefs, sea ice, and subtidal soft-bottom habitats
All models include Habitat Extent, which is not gapfilled, and is half of the calculation. But HAB is entirely modeled with Habitat Condition, which is all gapfilled for most places.
Habitats are one of our worst data sets. CP, CS goes down by ~50% because extent is ~50% of the score and extent is not gapfilled.
Habitat extent
Habitat health
Let’s have a look at the data included for Samoa:
So there is not a lot of data available for Samoa. This means that the goals are actually represented by this:
Carbon storage: 2 coastal habitats: mangroves (but the data is 0), seagrasses
Coastal Protection: 3 coastal habitats: mangroves (but the data is 0), seagrasses, coral reefs
Habitats sub-goal: 3 coastal habitats: mangroves (but the data is 0), seagrasses, coral reefs
Discussion
- Are there better data available?
- Should we look into the gapfilling question more?
Tourism & Recreation
TR is 100% gapfilled for Samoa.
Questions:
- What would be better ways to model TR for Samoa? What is important to capture?
- What data are available locally in Samoa?
- Is there local data to represent percent direct employment in tourism (tr_jobs_pct_tourism): Percent direct employment in tourism?
Natural Products
Global Data
Which Natural Products are included for Samoa?
So there are two products here.
We can also look at how much of this was gapfilled:
Discussion
- are there other products that should be included?
- is this a goal that represents Samoa well?
Species-based goals
Global data
Species subgoal of Biodiversity: There are 1466 unique species for Samoa
Iconic Species subgoal of Sense of Place: There are 10 unique species for Samoa
For Species, there are probably more than we can go through today. But, here is a table that has the full list:
It might be more manageable to work with the Iconic Species list:
Let’s also look at this list in the presentation since there are so many.
This is something that we could explore and we could potentially recalculate together.